
Revise
Rate of Reaction
Rate of Reaction
The rate of a chemical reaction tells us how quickly the reaction takes place by looking at how the amount of products or reactants changes. Rates can be measured in terms of reactants or products and are often measured in seconds. Rate graphs can be used to show how the amount of a given substance changes during a reaction and can help us to calculate the rate of a chemical reaction.
Rates
Rates are used to express the speed or frequency with which a given process happens. When measuring the speeds of a process, rates are calculated by dividing the change of a given variable by the time in which the change has taken place.
For the mean rate of a chemical reaction, we measure the changes the amount of either the reactants or the products of the reaction:
\text{Mean Rate of Reaction}=\frac{\text{Amount of Reactant Used}}{\text{Time Taken}}
or
\text{Mean Rate of Reaction}=\frac{\text{Amount of Product Formed}}{\text{Time Taken}}
The amounts of reactant used or product formed are typically measured in either grams \left(\text{g}\right) or in cubic centimeters \left(\text{cm}^{3}\right). The time over which these changes take place is almost always measured in seconds \left(\text{s}\right).
The mean rate of a reaction is telling us about the change in an amount over a given time so its units are the unit change in amount per the unit change in time.
\text{g}/\text{s} or \text{cm}^{3}/\text{s}
Mean rates of reaction may also be measures in terms of moles, giving units of \text{mol}/\text{s}.
The mean rate of a chemical reaction will tell us how quickly or slowly that reaction takes place. If a reaction has a low rate, then it will happen slowly. Reactions with a higher rate will happen much more quickly. There are a number of factors that influence the rate, from temperature to concentration.

Rate Graphs
The rate of a chemical reaction can be investigated by constructing a rate graph. These graphs show the amount of a given substance in the reaction over a given amount of time. Rate graphs tend to be curves, as the rate of a chemical reaction will change as the reaction progresses. The shapes of these curves will depend on whether we are looking at changes in the reactants or at changes in the products.
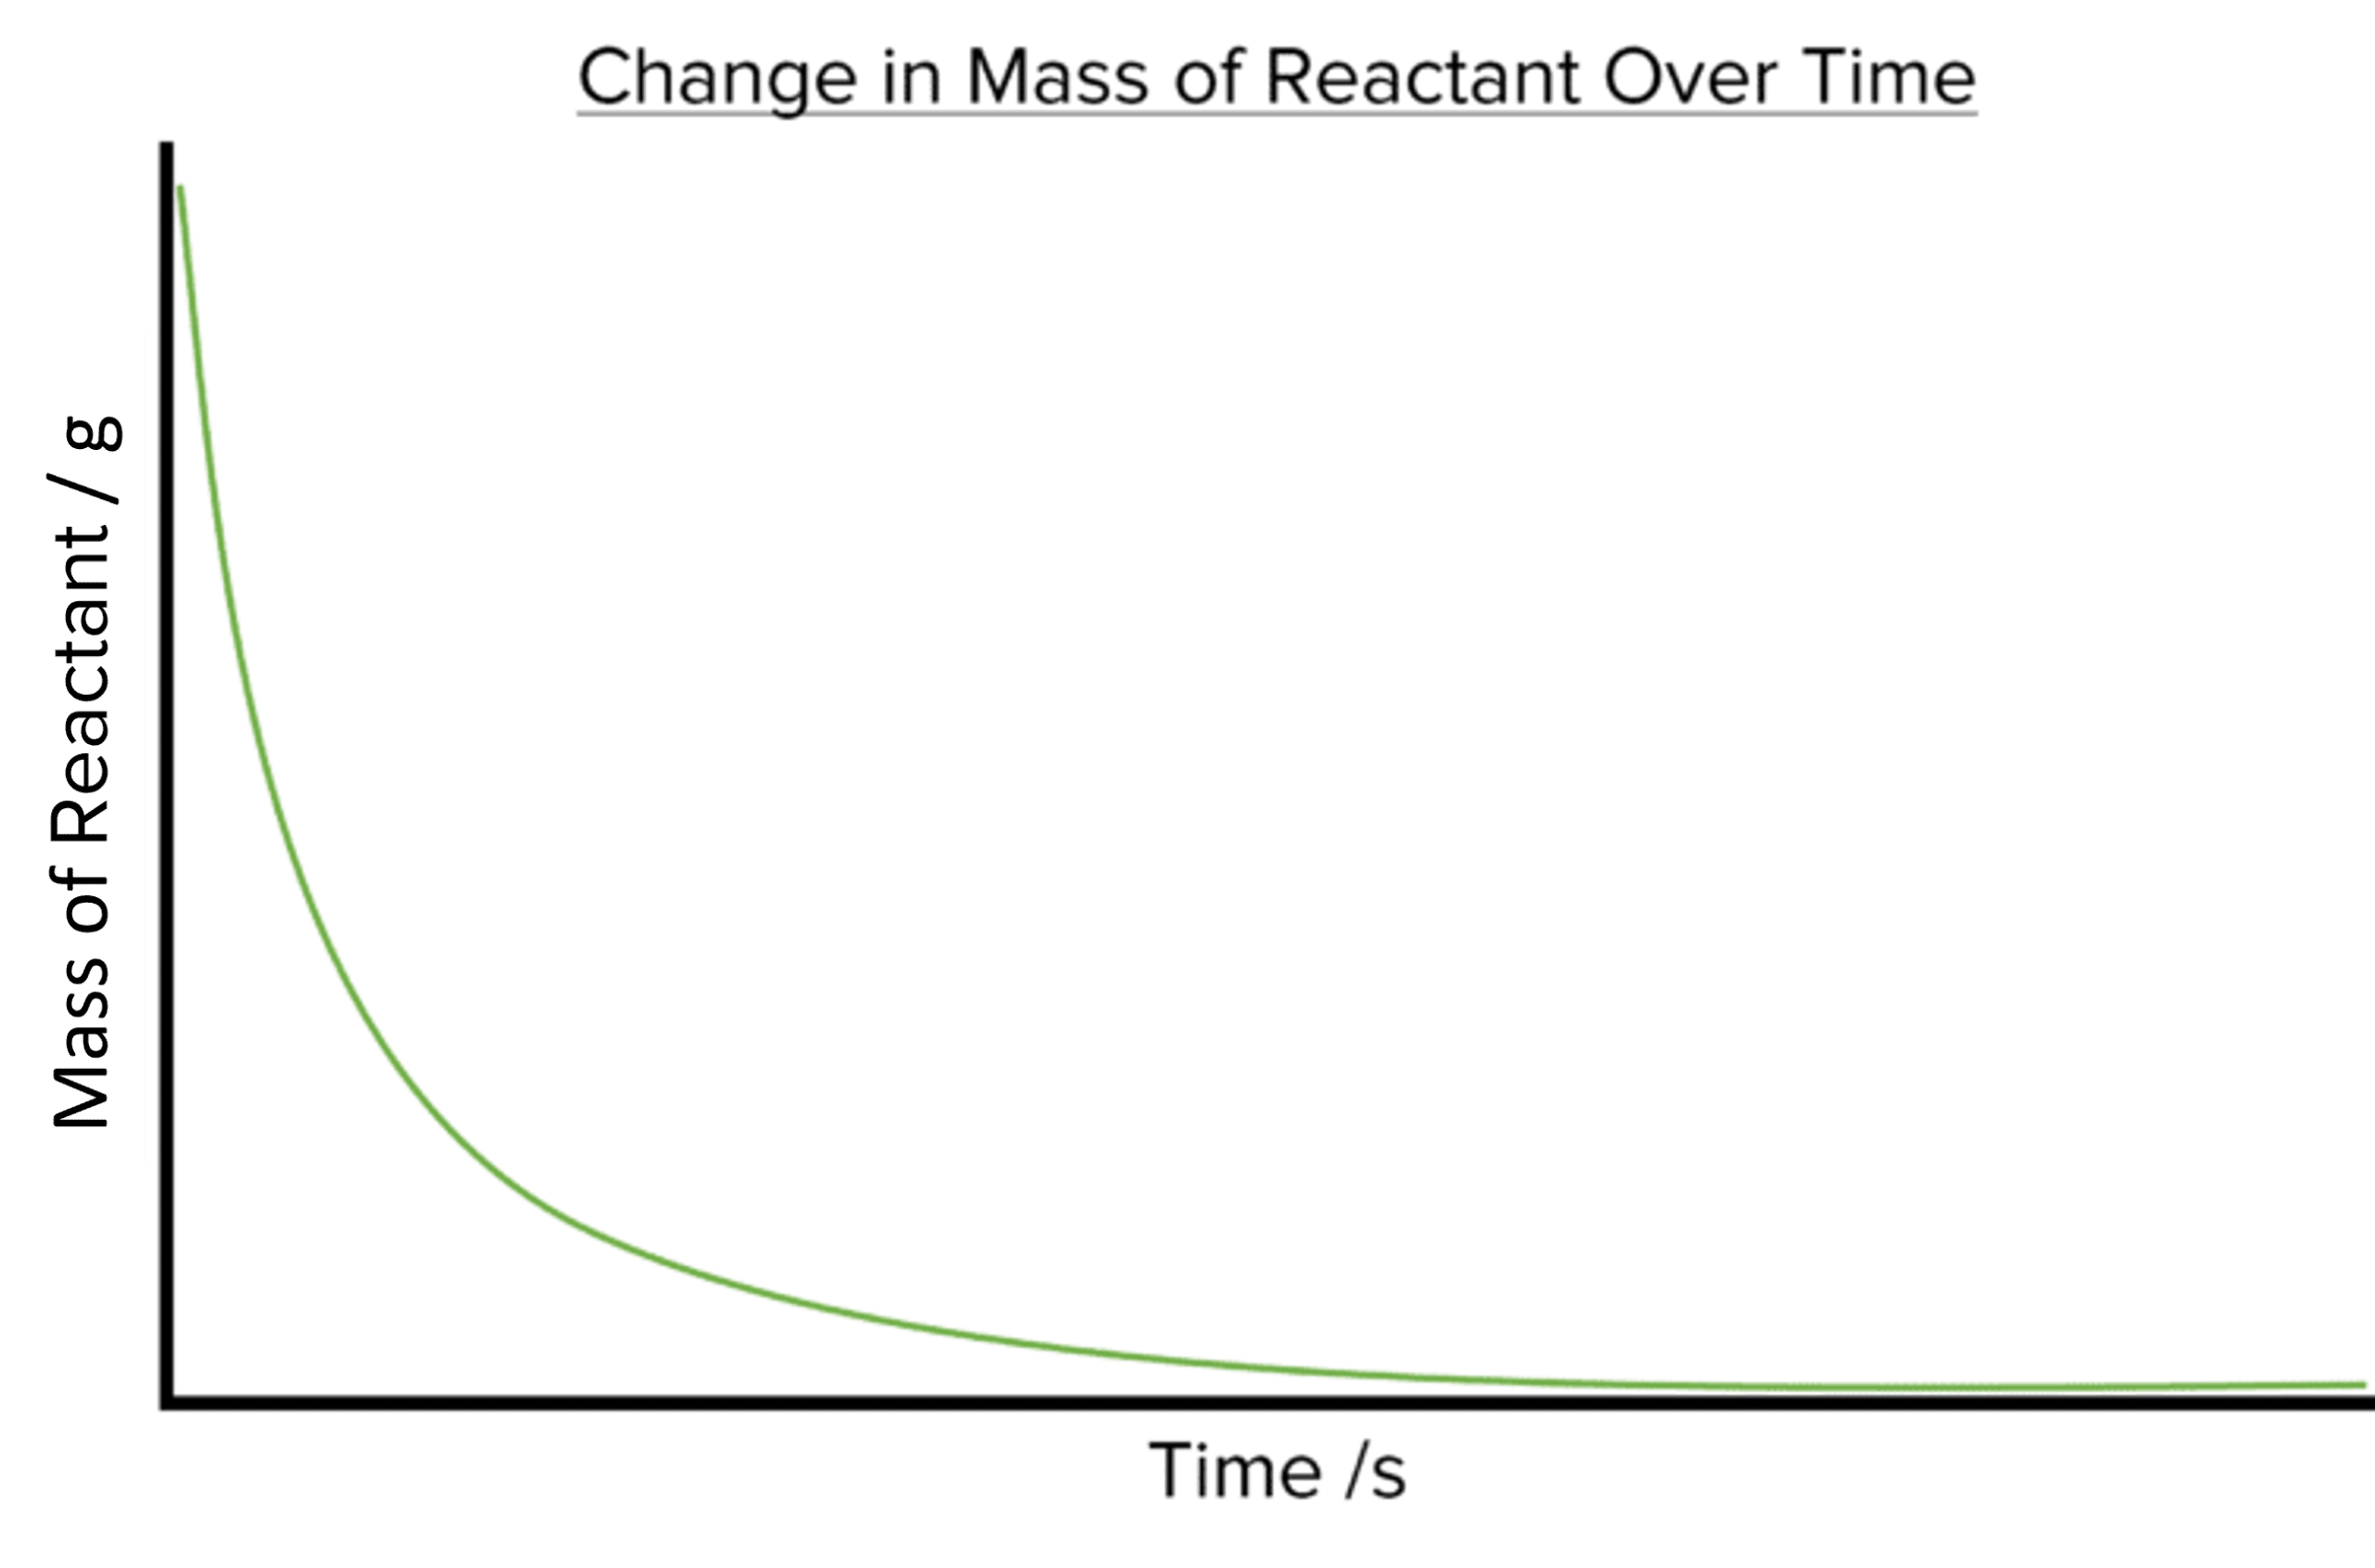
As the amounts of reactants in the reaction will decrease over time plotting the amount of the reactants against time will produce a downward sloping curve.
If instead we look at the changes in the amount product during a reaction, the rate graph produced will instead display an upward sloping curve as the amount of product increases with time.
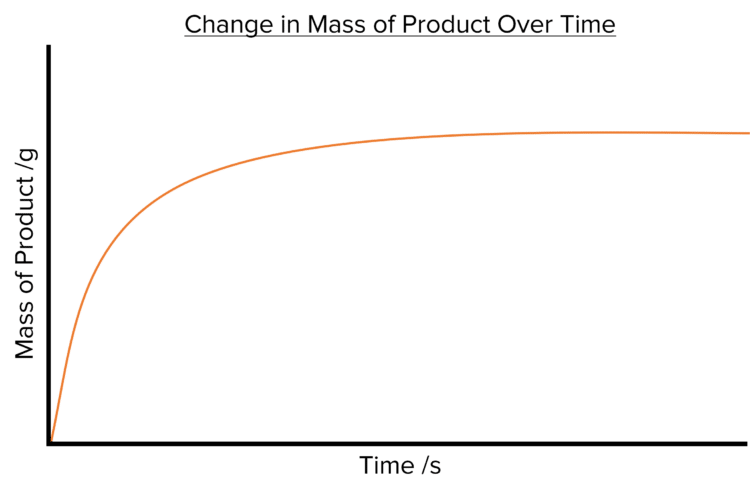
The steepness of both curves decreases with time.
There are a number of similarities between the two curves that tells us about the rate of chemical reactions.
- Both curves start off very steep, with lots of of reactant used or product formed in a short time. This tells us that the rate of reaction is fastest at the beginning of the reaction.
- Both curves eventually plateau (become flat). The amount of reactant or product has stopped changing at this point and so the rate of the reaction falls to zero. This tells us that the reaction has stopped.
- Both curves get less steep as time goes on. This tells us that the rate of a reaction will slow down as the reaction progresses. This is due to the decreasing amount of reactant available to the reaction.

Calculating the Rate of Reaction from a Rate Graph
Rate graphs allow us to calculate the rate of a chemical reaction. To calculate the rate of reaction from a rate graph we must first draw a tangent to the curve of the graph.
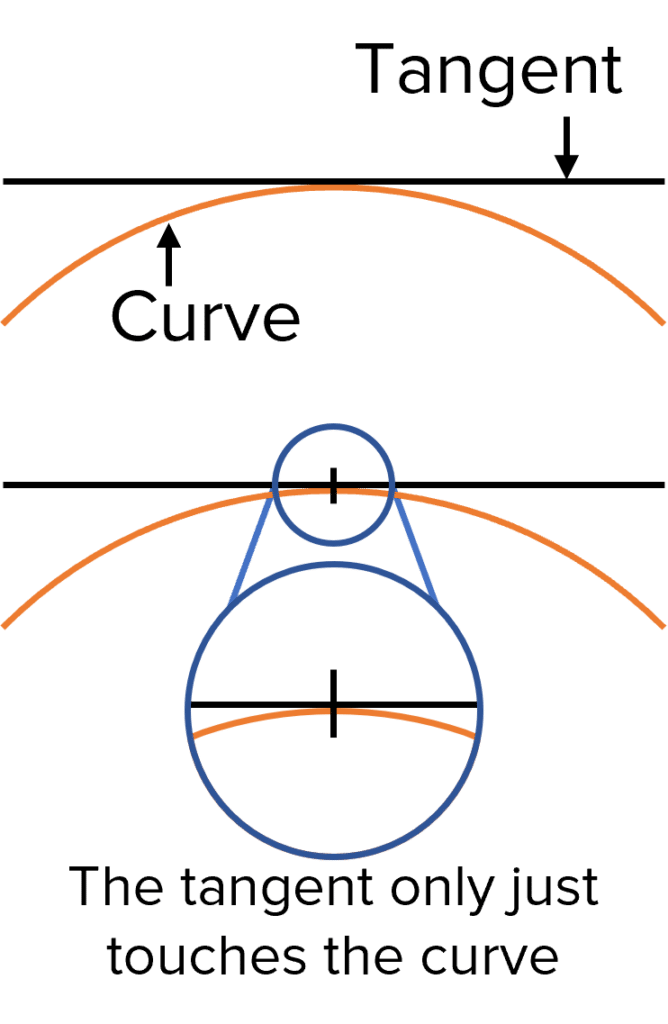
Drawing a Tangent
To find the gradient of a curve we must draw a line called a tangent. Tangents are straight lines that touch curved lines but do not cross them at any point.
Tangents allow us to find the gradient of a curved graph by providing a straight line to help us find the changes in the y and x-axis values. Gradients calculated using a tangent represent the gradient of the curve at the point where the two lines meet. This allows us to calculate rates of reaction at specific times along the x-axis.
Calculating Rates of Reaction using Tangents
To calculate the rate of a reaction from a rate graph, a tangent must first be drawn to the curve. Two lines should then be drawn down from two points along the tangent to the x-axis. The difference between the points where these lines meet the x-axis will give us the change in time. Next, two lines should be drawn from the ends of the tangent to the y-axis. The difference between the two points where these lines meet the y-axis will give us the difference in the amount of substance.
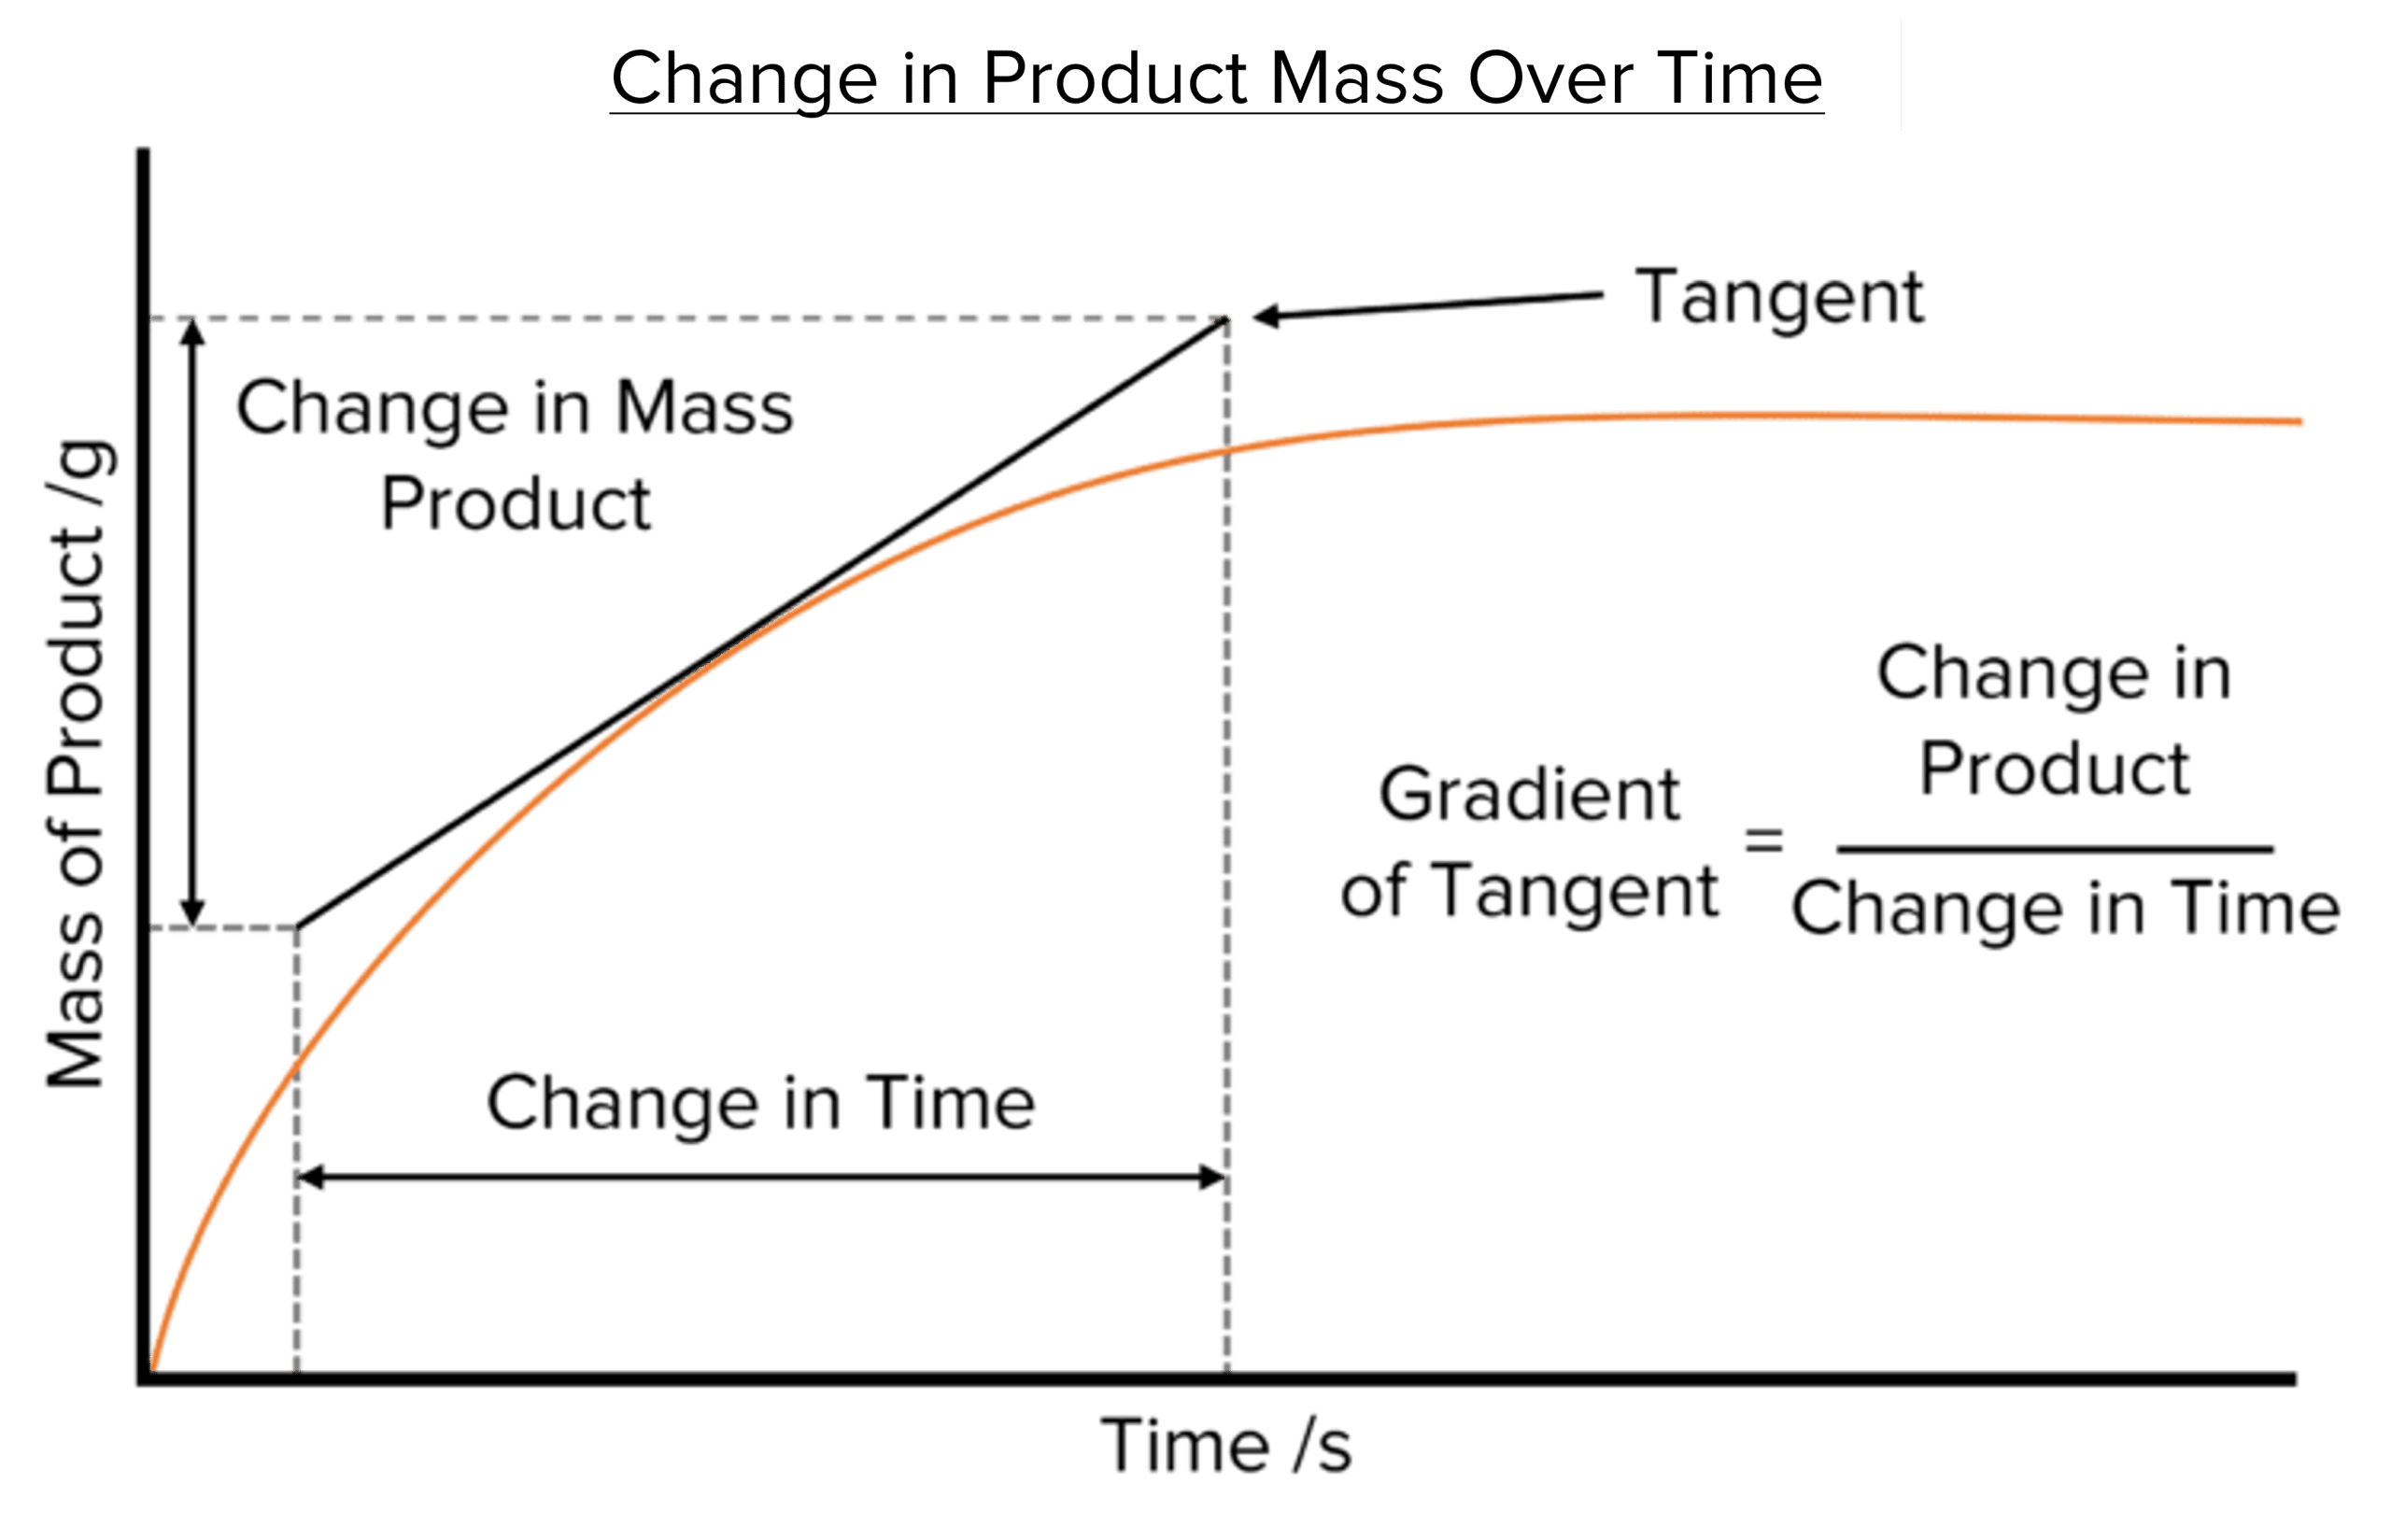
Finally, we can calculate the rate of reaction by find the slope of the tangent. To do this we divide the change in the amount of substance by the change in time:
\text{Rate of Reaction}=\text{Gradient of Tangent}=\frac{\text{Change in Amount}}{\text{Change in Time}}
It is important to note that the rate calculated from this gradient is the rate of reaction at the point on the curve at which the curve and tangent meet and so at the corresponding time along the x-axis. To find the rate of reaction at a given time, a line should be drawn up from the time on x-axis and the tangent drawn so that it meets the curve where this line crosses it.

Example: Calculating Rates of Reaction
In a chemical reaction, \textcolor{#00bfa8}{20\text{ g}} of sodium hydrogen carbonate is produced. The reaction takes 12 minutes. Calculate the mean rate of the reaction. Give your answer in \text{ g}\text{ s}^{-1}.
[2 marks]
Step 1: Convert the time into seconds.
\text{t (s)}=\text{t (min)}\times60 =\textcolor{#f21cc2}{12}\times60 =\textcolor{#008d65}{720\text{ s}}
Step 2: Calculate the mean rate. In this example the amount of product formed is measured by the mass.
\begin{aligned}\text{mean rate}&=\frac{\text{mass of product}}{\text{time}}\\\text{}\\ &=\frac{\textcolor{#00bfa8}{20}}{720}\\\text{}\\ &=\textcolor{#008d65}{0.028\text{ g}/\text{s}}\end{aligned}
Rate of Reaction Example Questions
Question 1: During a chemical reaction, 5.6\text{ cm}^{3} of \text{HCl} is used up. The reaction takes 120 seconds.
Calculate the mean rate of reaction.
[1 mark]
\begin{aligned}\text{Rate}&=\frac{\text{Amount of Reactant Used}}{\text{Time Taken}}\\\text{}\\ &=\frac{5.6}{120}\\\text{}\\ &=0.047\text{ cm}^{3}/\text{s}\end{aligned}

Question 2: In another reaction, 7.9\text{ g} of sodium chloride is produced. This reaction takes 3.5 minutes.
Calculate the mean rate of reaction. Give your answer in \text{ g}\text{ s}^{-1}.
[2 marks]
Step 1: Convert the time into seconds.
\text{time (s)}=\text{time (mins)}\times60 ={3.5}\times60 =210\text{ s}
Step 2: Calculate the mean rate.
\text{mean rate of reaction}=\frac{\text{mass of product}}{\text{time Take}}\\ =\frac{7.9}{210}\\ =0.038\text{ g}/\text{s}
(One mark per correct step.)
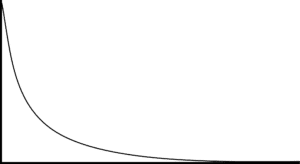
Question 3: State whether the following graph shows a change in the reactants or products of a reaction. Explain your answer.
[3 marks]
The graph shows the change in reactants.
The graph slopes downwards so the amount of substance is decreasing with time.
Question 4: A student carries out a reaction to measure its rate of reaction. The student measures the mass of the product produced and plots this on a graph against time in seconds. The graph is displayed below:
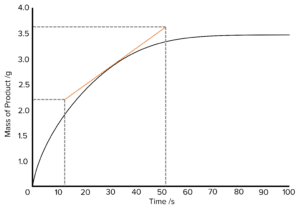
Calculate the rate of this reaction. A tangent has been drawn for you.
[3 marks]
\text{Rate of Reaction}=\frac{\text{Change in Mass}}{\text{Change in Time}}\\\text{}\\=\frac{3.75-2.23}{52-12}\\\text{}\\=\frac{1.52}{40}\\\text{}\\=0.038\text{ g}\text{ s}^{-1}
Specification Points Covered
AQA GCSE –
4.6.1.1 – Calculating Rates of Reaction
Rate of Reaction Worksheet and Example Questions
Rate of Reactions
GCSEOfficial MME