
Revise
Instrumental Methods
Instrumental Methods
Instrumental methods in chemistry can be incredibly useful. Using machines to run experiments offers many advantages to doing them by hand. One such instrumental method is flame emission spectroscopy. This can be used to identify the atoms or ions that are present in a sample using visible light.
Chemical Instruments
Chemical instruments, though not very musical, are fantastically useful. Instrumental methods in chemistry are used to analyse and quantify reactions in a much greater detail then would ever be possible using simple chemical tests or human observations.
Chemical instruments use a range of different techniques to analyse samples with a high degree of precision and accuracy. These techniques range from spectroscopy (the analysis of radiation emitted or absorbed by a sample) to gravimetry (the analysis of a sample by looking at its mass).
These chemical methods are usually made up of two components. The first is the instrument itself, for example an Infra Red (IR) spectrometer. The spectrometer automatically preforms a small experiment on a sample, generating data on one or more of the sample’s properties. This data is then fed into a computer where it is analysed. This analysis then produces either a table or a graph that can be interpreted and analysed further by a scientist.
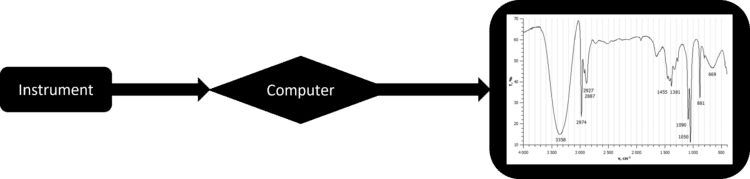
By using a computer to handle the data from the chemical instrument, it becomes practical to analyse a great deal more of it. Many chemical instruments will generate thousands of data in a very short space of time, which can be quickly analysed and graphed by a computer. This allows scientists to analyse samples in a much greater detail than they ever could carrying out experiments by hand.
Not only do instrumental methods allow for more data to be generated and analysed, they also allow scientists to carry out many more experiments than they could by hand. Instrumental methods are much less labour intensive than experiments carried out by hand. This means that fewer scientists can carryout more experiments using machines. In addition to being less labour intensive, machines often carry out experiments faster than human beings are able to, and can be set up to run automatically.
Finally, machines are also much more sensitive than a human being. This allows them to use with much smaller samples, ranging down to micrograms of materials. They are also able to observe things on a much smaller scale, such as changes in mass or the order of micrograms, or over times as short as a microsecond.

Flame Emission Spectroscopy
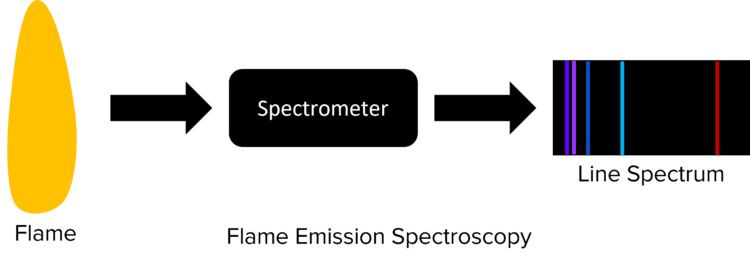
Flame emission spectroscopy is a common technique to analyse the elements and ions contained within a sample. In flame emission spectroscopy, a sample is placed in a flame, causing it to burn. The light from this flame is then passed through a spectrometer which is able to detect the different wavelengths of radiation that are present. This information is used to produce something called a line spectrum.
The line spectra produced will be unique to the ion or atom contained in the sample. When the sample is placed in the flame it heats up. This causes electrons in the sample to become excited, jumping to higher energy levels. These electrons will then fall back to their original energy levels, releasing radiation as they do so.
This radiation often falls within the visible spectrum an will correspond to specific colours. By analysing these emissions we can produce a line spectrum. These line spectra contain only the light emitted by the sample, and consist of narrow lines found at fixed wavelengths. To illustrate this, the line spectrum for hydrogen is shown below.
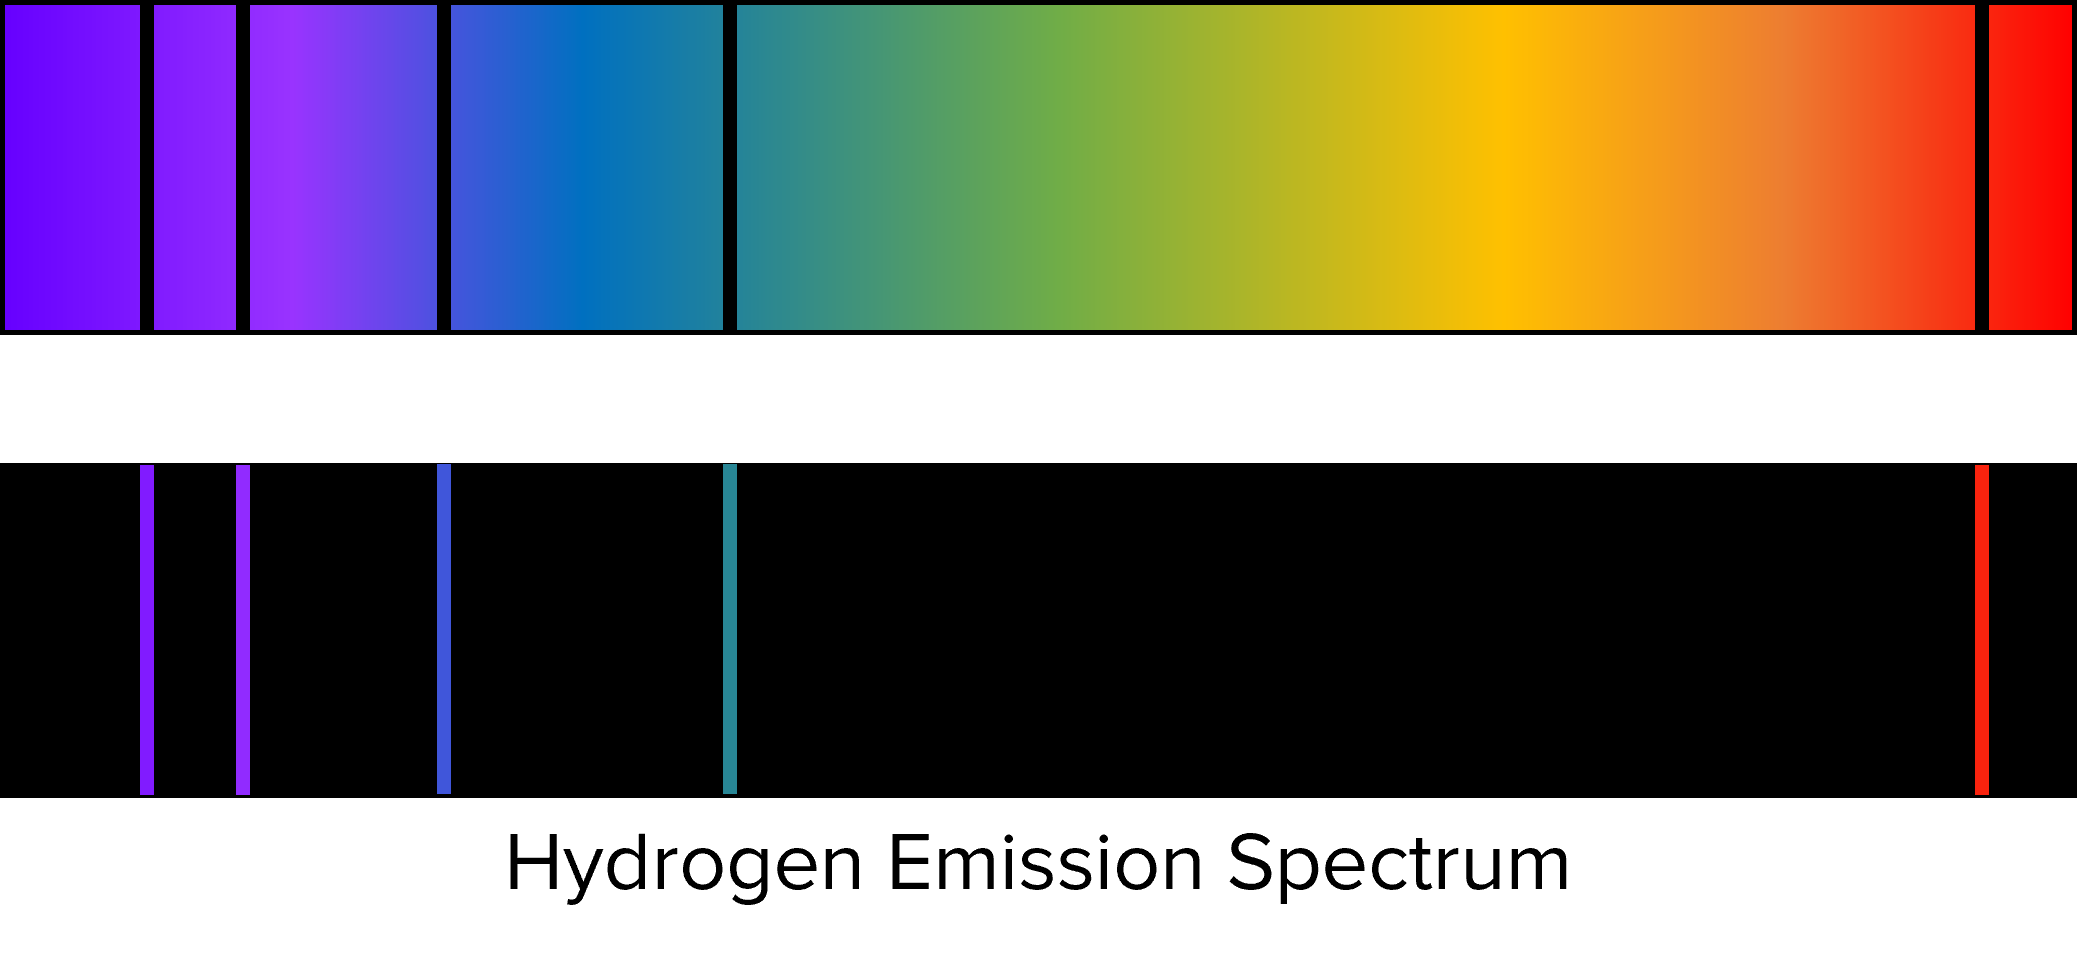
Above the line spectrum is shown the visible spectrum of light. We see that the black lines in the visible spectrum correspond to the lines of the emission spectrum. Where these lines appear in the spectrum of a given atom or ion will be determined by its charge and electron configuration.
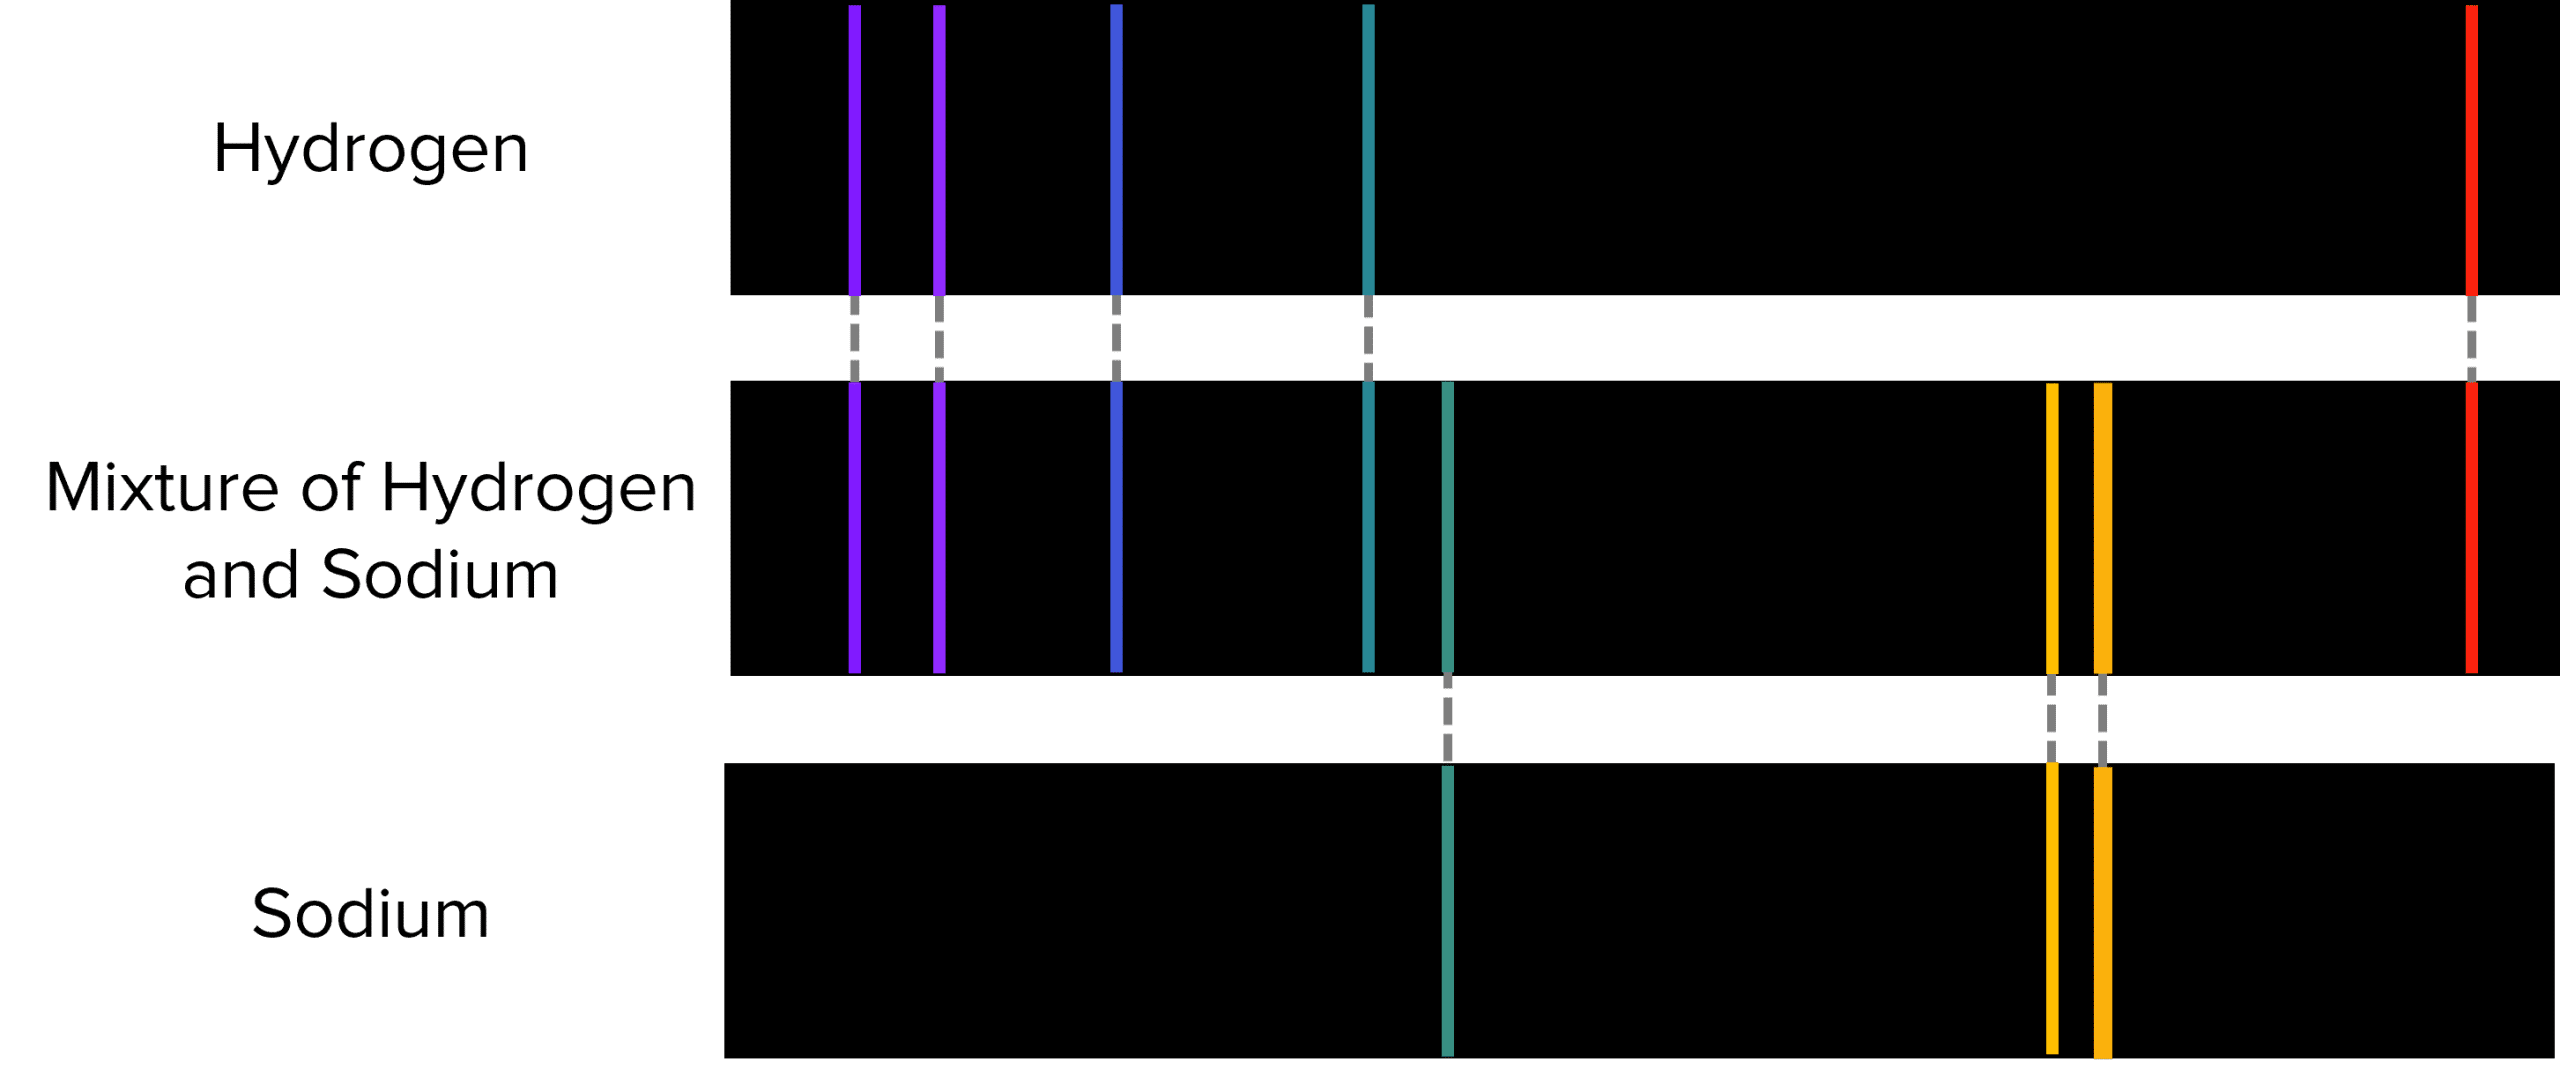
These unique spectra can be used to determine the identity of single ions and of ions in a mixture. For example, a mixture of hydrogen and sodium atoms would produce the following line spectra.

In reality, this is not one line spectra but two put together, one for hydrogen and one for sodium. If we know which lines should appear in an elements spectrum, we can tease out the individual spectra that make it up:
Line spectra have been incredibly useful in studying the composition of stars and other celestial bodies. By studying the line spectrum of the sun for example, it was possible to discover which elements were present by looking for known spectra in the mixture.
Line spectra can also be used to calculate the concentration of ions in a sample. The intensity of the emission lines in a spectrum will be proportional to the number atoms that are creating it, allowing us to calculate concentrations.

Instrumental Methods Example Questions
Question 1: State two advantages of using instruments in chemistry.
[2 marks]
Any two from:
- More sensitive.
- Less labour intensive.
- Faster.
- Can analyse more data.
- Can analyse samples in more detail.
- Can be automated.

Question 2: Why can emission spectroscopy be used to calculate concentrations?
[1 mark]
Because the intensity of the lines in the spectrum is proportional to the number of atoms or ions in the sample.
Question 3: Identify which line spectra is not present in the mixture.
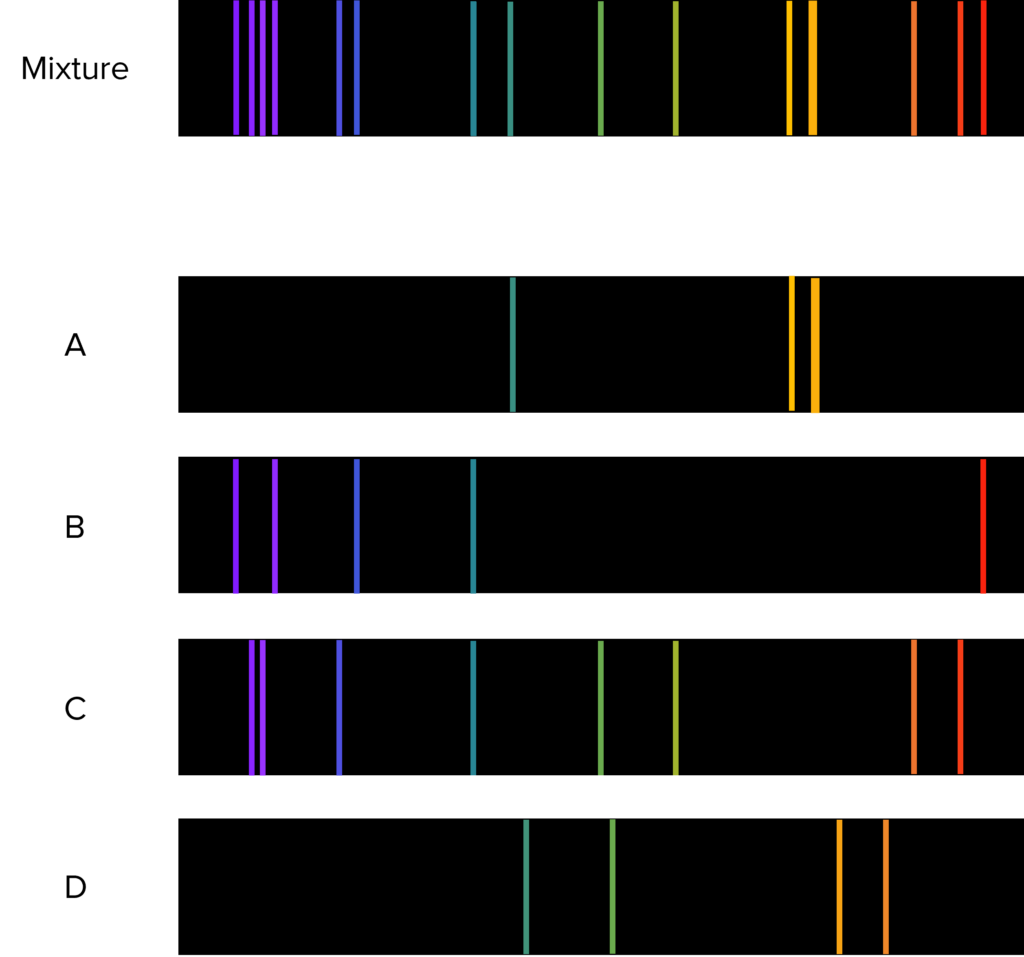
[3 marks]
Spectrum D
The lines contained with in spectrum D are not found in the mixed spectrum where as the lines of all the other spectectra are.
Specification Points Covered
AQA GCSE –
4.8.3.6 – Instrumental Methods
4.8.3.7 – Flame Emission Spectroscopy