Inequalities
Inequalities Revision
Inequalities
You can solve inequalities by rearranging and solving them, just like for normal equations. You just need to be careful to make sure the inequality is in the right direction. For harder inequalities, such as quadratics, you can sketch a graph to help visualise the inequalities.
Set Notation
You may be asked to give your answers to inequality questions using set notation, so it will be useful to learn these:
- We use curly brackets to define a set: e.g. \{x : x > 5 \} means “the set of values such that x is greater than 5”
- The empty set, denoted \emptyset, contains nothing.
- The intersection, denoted \cap, of two sets contains only the elements present in both sets.
- The union, denoted \cup, of two sets contains all elements contained in either set.
Note:
- When adding or subtracting, the inequality sign doesn’t change direction.
- When multiplying or dividing by positive numbers, the inequality sign doesn’t change direction.
- When multiplying or dividing an inequality by a negative number, the direction of the inequality sign changes.
Solving Basic Inequalities
You solve inequalities in a similar way to how you solve normal equations. You just need to be careful with the direction of the inequality sign.
Example: Find the range of values of x that satisfies 3x - 5 < - 1 + x, giving your answer in set notation.
Add 5 to both sides:
3x \textcolor{red}{<} 4 + x
Subtract x from both sides:
2x \textcolor{red}{<} 4
Divide both sides by 2 and keep the direction of the inequality the same:
x \textcolor{red}{<} 2
In set notation, this is \{ x : x < 2 \}
Example: Find the range of values that satisfies 5 - 5y \geq 20
Subtract 5 from both sides:
-5y \textcolor{blue}{\geq} 15
Divide both sides by -5 and change the direction of the inequality:
y \textcolor{limegreen}{\leq} - 3
Note: You can do the last part in more than one step to help you understand why we change the sign of the inequality:
-5y \geq 15 \,\, \Rightarrow \, -15 \geq 5y \,\, \Rightarrow \,\, y \leq -3
Solving Quadratic Inequalities
For quadratic inequalities, it is helpful to sketch a graph to visualise the inequalities.
Example: Find the range of values of x that satisfies 48x \geq 12x^2
Rearrange so that the equation is in the form f(x) \leq 0:
\begin{aligned} 48x &\geq 12x^2 \\ 4x &\geq x^2 \\ 0 &\geq x^2 - 4x \\ x^2 - 4x &\leq 0 \end{aligned}
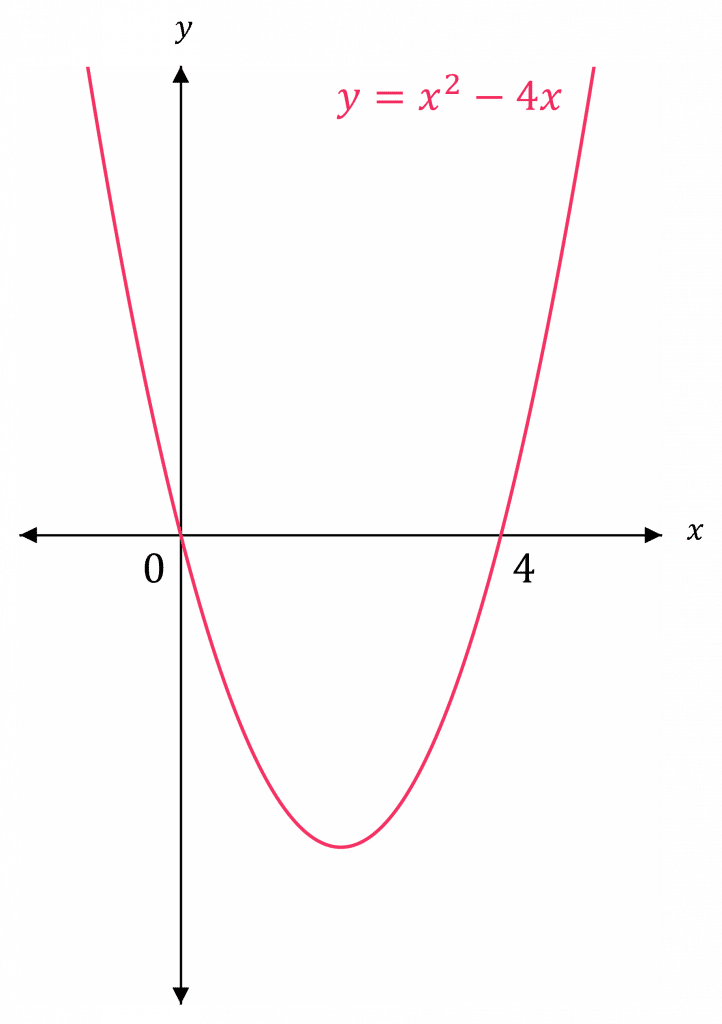

Don’t divide by x here since it could be zero or negative.
Write this as an equation:
y = x^2 - 4x
Now, we can solve to find the roots, by setting y=0:
\begin{aligned} x^2 - 4x &= 0 \\ x(x-4) &= 0 \end{aligned}
\textcolor{red}{x = 0} and \textcolor{red}{x = 4}
So, the graph crosses the x-axis at x=0 and x=4
Now, draw a sketch of y = x^2 - 4x, and use it to find where
x^2 - 4x \leq 0.
The graph is \leq 0 in between \textcolor{red}{x=0} and \textcolor{red}{x=4}.
Hence,
\textcolor{red}{0 \leq x \leq 4}
Inequality Regions
If you are given 2 or more inequalities, you may be asked to draw the region that satisfies all of them.
To draw a graphical inequality, use the following steps:
Step 1: Treat the inequalities as equations in terms of y and x.
Step 2: Plot the equations,
using a solid line if the inequality is \leq or \geq
using a dashed line if the inequality is < or >
Step 3: Identify the region the inequalities hold true for, then shade the corresponding area,
- Shade the area above lines (for y) or to the right (for x) if it is greater than (or equal to)
- Shade the area below lines (for y) or to the left (for x) if it is less than (or equal to)
Note: You can try coordinates of a point within the region to see if it holds true for all inequalities – then you know you have shaded the region correctly.
Example: Inequality Regions
Draw and label the region that satisfies the following inequalities:
\begin{aligned} y &\geq x^2 - x - 2 \\ y &< 4 \end{aligned}
[4 marks]
Write the inequalities as equations:
\begin{aligned} y &= x^2 - x - 2 \\ y &= 4 \end{aligned}
Draw them on the axes:
\begin{aligned} y &= x^2 - x - 2 \\ y &= (x+1)(x-2) \end{aligned}
y = 0 at x = -1 and x = 2
y = 4 is a horizontal line
So sketch \textcolor{red}{y=x^2 - x - 2} passing through the x-axis at x=-1 and x=2 as a solid line (since \geq means solid line)
And sketch \textcolor{blue}{y = 4} as a dashed line (since < means dashed line)
Determine which side of the line and the curve we need to shade:
- y<4, so we need to shade below the line y=4
- y \geq x^2 - x - 2, so we need to shade above the curve y = x^2 - x - 2
- Therefore, we need to shade the region enclosed by the line and the curve. Label this R.
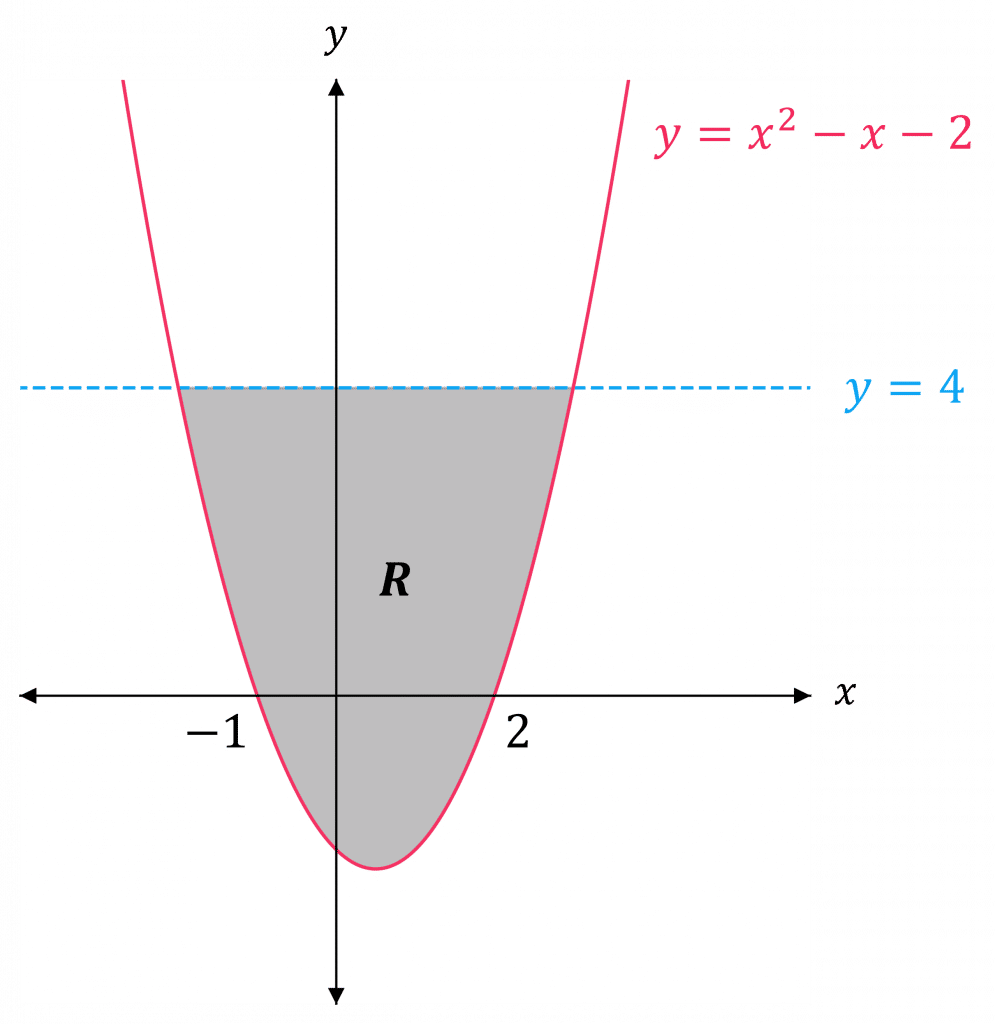

Try a point that lies within this region to see if it is correct for both inequalities:
The origin (0,0) lies in the shaded region, so try this,
\begin{aligned} y &\geq x^2 - x - 2 \\ 0 &\geq 0^2 - 0 - 2 \\ 0 &\geq -2 \end{aligned}
which is true.
\begin{aligned} y &< 4 \\ 0 &< 4 \end{aligned}
which is also true.
Hence, the region must be correct.
Inequalities Example Questions
Question 1: Find the range of values of x that satisfies 3 - 2x \leq 8
[2 marks]
Question 2: Find the range of values of x that satisfies x^2 - 3x + 4 > x^2 - 5x + 12
[2 marks]
Question 3: Find the range of values of x that satisfies x^2 \geq 3x + 4
Give your answer in set notation.
[3 marks]
Rearrange to get
x^2 - 3x - 4 \geq 0
Write the inequality as an equation:
y = x^2 - 3x - 4
Set y=0 and solve for x:
\begin{aligned} x^2 - 3x - 4 &= 0 \\ (x-4)(x+1) &= 0 \end{aligned}
So, x = -1 and x = 4
Now, draw a sketch of y = x^2 - 3x - 4 and use this to find where x^2 - 3x - 4 \geq 0
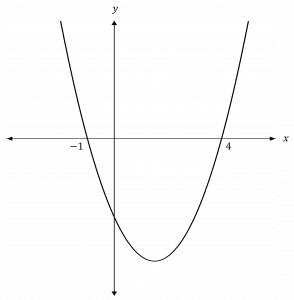
The graph is \geq 0 to the left of -1 and to the right of 4
Therefore, x \leq -1 and x \geq 4
In set notation, this is
\{x : x \leq 1 \} \cup \{x : x \geq 4 \}
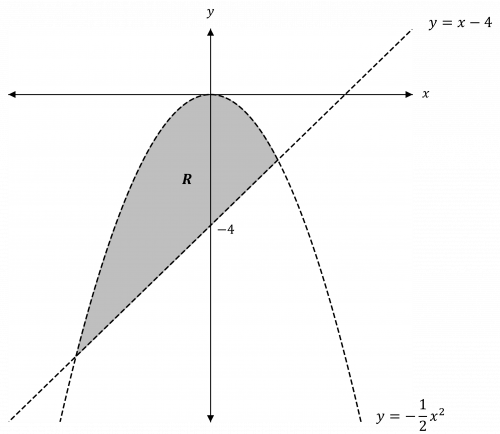
Question 4: Draw and label the region that satisfies the following inequalities:
y + \dfrac{1}{2}x^2 < 0
y > x - 4
[4 marks]
Write the inequalities as equations with y on the left and x on the right:
y = - \dfrac{1}{2}x^2
y = x - 4
Draw them on the same axes:
y = - \dfrac{1}{2}x^2 is an n-shaped quadratic curve touching at the origin, and the line needs to be dashed (since < means dashed)
y = x - 4 is a straight line passing through -4 on the y-axis. The line needs to be dashed also (since > means dashed)
y < - \dfrac{1}{2}x^2, so shade below the line y = - \dfrac{1}{2}x^2
y > x - 4, so shade above the line y = x - 4
Therefore, we need to shade the region enclosed by the line and the curve. Label this R.
