Statistics Calculations
Statistics Calculations Revision
Statistics Calculation
When processing experimental data, there are many calculations you may have to perform. This page covers some of the common statistical calculations you should be familiar with.
Mean
Calculating the mean is a good way to determine the average value of a set of data. The equation for mean is:
\text{mean} = \dfrac{\text{sum}}{\text{n}}
- \text{sum}= all of the data points added together
- \text{n}= how many values you have measured, or the number of pieces of data


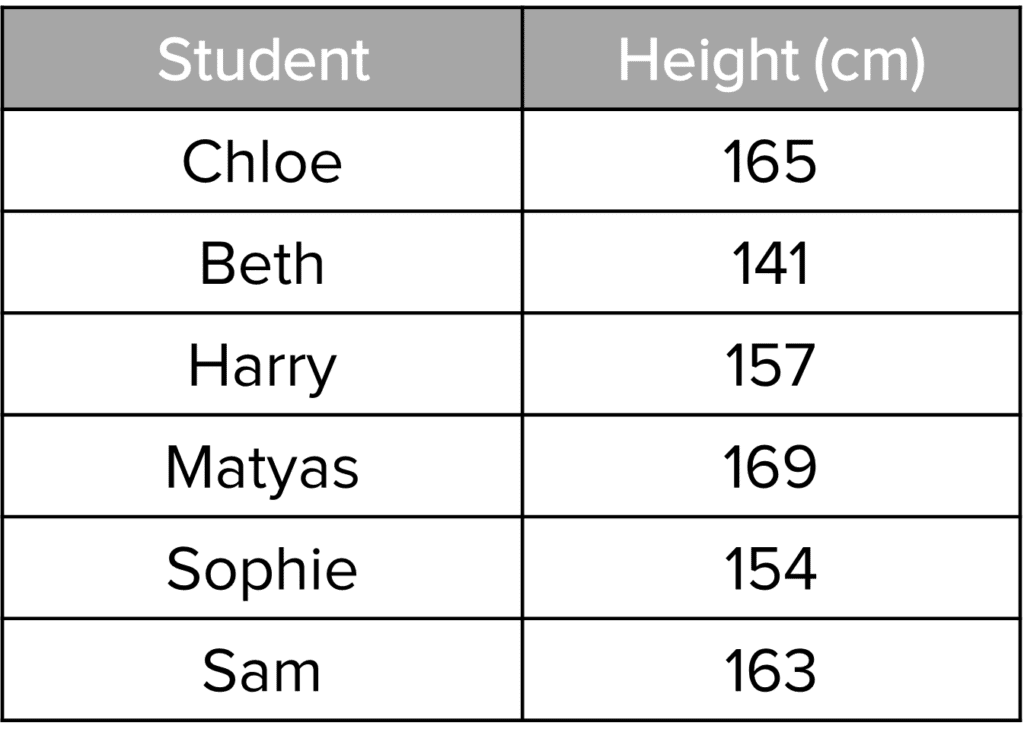
Example: A student records their friends’ heights in the table on the right.
Calculate the mean height of the students.
[3 marks]
\text{sum of the data} \\ = 165 + 141 + 157 + 169 \\ \, + 154 + 163 \\ = \bold{949} \textbf{ cm}\text{number of pieces of data} = \bold{6}
\text{mean}= \dfrac{\text{sum}}{\text{n}}= \dfrac{949}{6}= \bold{158.2} \textbf{ cm}
Range
The range gives you an idea of the spread of the data. It is calculated using the following equation:
\text{range}=\text{maximum value}-\text{minimum value}


Example: For the same data in the previous example, calculate the range.
[1 mark]
\text{range} \\ \begin{aligned} &= \text{max value}-\text{min value} \\ &= 169 - 141 \\ &= \bold{28} \textbf{ cm} \end{aligned}Standard deviation is also used to represent the spread of the data, or the uncertainty in the mean. A large standard deviation means that the data is spread out and the mean has a large uncertainty. A small standard deviation means that the data points are close together and so there is a small uncertainty in the mean. You don’t need to know how to calculate the standard deviation for GCSE.
Percentage Increase
Percentage increase is used to compare two data points, usually after some amount of time has passed. You can calculate the percentage increase using the following equation:
\% \text{ increase}=\dfrac{\text{new value}-\text{old value}}{\text{old value}} \\ \times 100
Example: A piece of potato is initially measured to have a mass of 9.4 \text{ g}. After being placed in a beaker of water and left for 2 \text{ hours}, the mass of the potato is measured to be 12.6 \text{ g}. Calculate the percentage increase in the mass of the potato.
[2 marks]
\% \text{ increase}\\ \begin{aligned} &= \dfrac{\text{new value}-\text{old value}}{\text{old value}} \times 100 \\ &= \dfrac{\textcolor{7cb447}{12.6} - \textcolor{10a6f3}{9.4}}{\textcolor{10a6f3}{9.4}} \times 100 \\ &= \bold{34.04 \%} \end{aligned}
Statistics Calculations Example Questions
Question 1: A student records the time it takes some student’s in their class to run a race. The results are in the following table.

Calculate the mean time.
[3 marks]
\text{number of data values} = \bold{10}
\text{mean}=\dfrac{\text{sum of the data}}{\text{number of data values}} = \dfrac{553}{10} = \bold{55.3} \textbf{ s}
Question 2: A student records the time it takes some student’s in their class to run a race. The results are in the following table.

Calculate the range in the data.
[1 mark]
Question 3: One student runs a race in 51 \text{ s}. They run the race a second time, but now they are tired so it takes them 56 \text{ s}.
Calculate the percentage increase in the time it took the student to run the race.
[2 marks]


