
Revise
Motion Graphs
Motion Graphs
When objects are in motion, their distance and velocity can be plotted against time. We can show how these quantities change over a period of time.
Distance-time graphs
Distance-time graphs show how an objects distance changes with time. Distance should be plotted on the y axis, and time on the x axis.
We know:
\text{speed} = \dfrac{\text{distance}}{\text{time}}
The gradient of the distance-time graph is:
\dfrac{\text{change in vertical axis}}{\text{change in horizontal axis}} = \dfrac{\text{distance}}{\text{time}}
Therefore the gradient of a distance-time graph is equal to the speed.
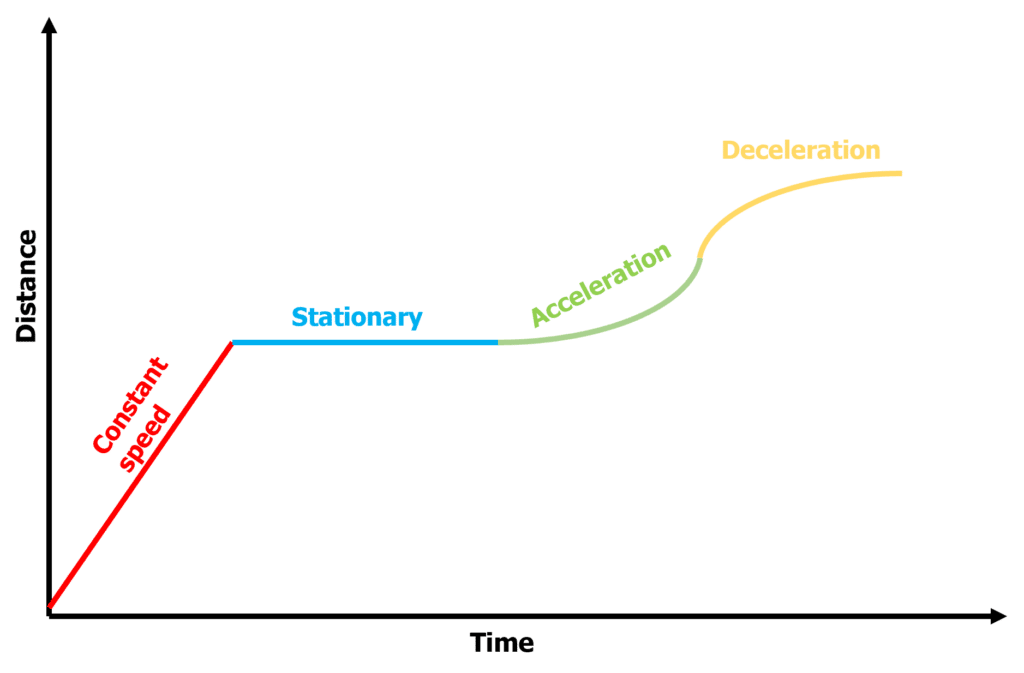
- The steeper the graph is, the higher the speed.
- If the graph is a straight line, then the speed is constant.
- If the graph is flat, then no distance is travelled in the time period, so the object is stationary.
- If the graph is curved upwards, then the object is accelerating (speeding up). If the graph is a curve that is levelling out, then the object is decelerating (slowing down).

Velocity-time graphs
Velocity-time graphs show how an objects velocity changes over time. The gradient of a velocity-time graph is:
\dfrac{\text{change in vertical axis}}{\text{change in horizontal axis}} = \dfrac{\text{velocity}}{\text{time}}
Therefore the gradient of a velocity time graph is equal to the acceleration.
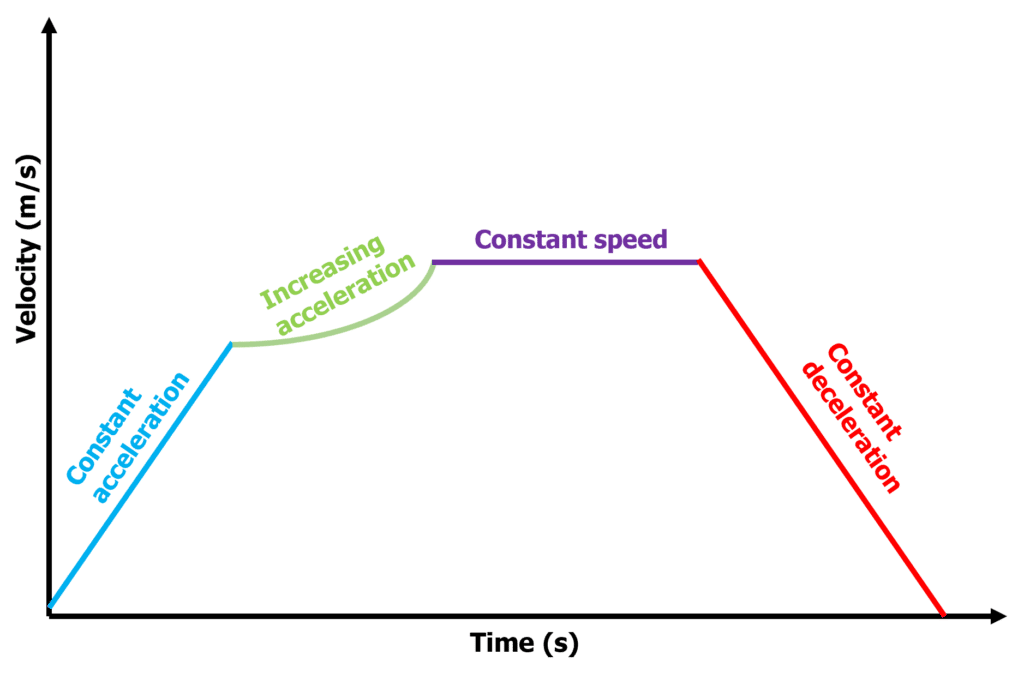
- Straight uphill sections represent constant acceleration, downhill sections represent constant deceleration.
- Flat sections represent the object travelling at a constant speed.
- A curve represents a changing acceleration.

Distance from a Velocity-Time graph
Higher tier students need to know how to use velocity-time graphs to determine the distance travelled by an object.
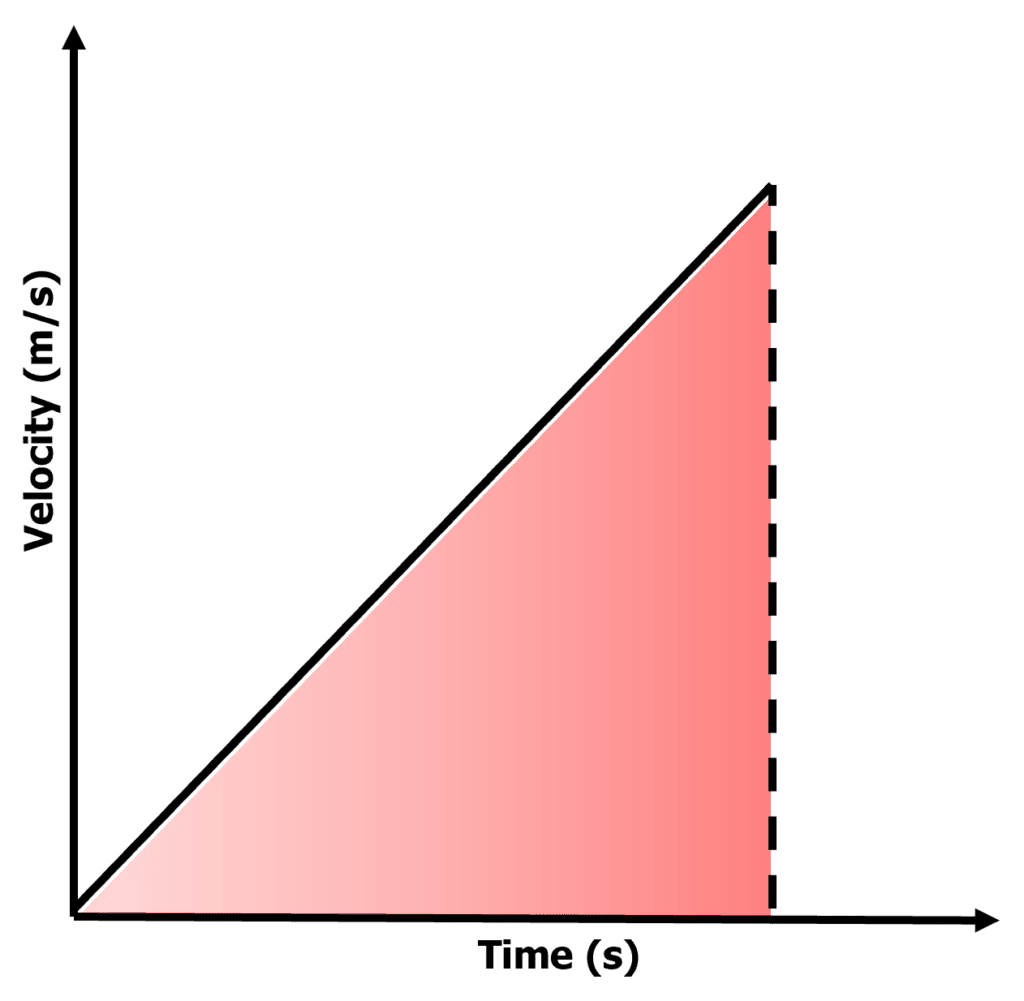
We know that \textcolor{00bfa8}{\text{distance} = \text{speed} \times \text{time}}. This corresponds to the area under the velocity-time graph. So the distance travelled = area under the graph.
If the area is an irregular shape, it might be easier to count the amount of squares in the area and then multiply this number by the value of 1 square.
For this diagram on the right, the area of the red shaded triangle gives the distance travelled. So the calculation would be:
\text{distance} = \dfrac{1}{2} \times \text{velocity} \times \text{time}
because this gives the area of the triangle.
Velocity-Time graphs and Terminal Velocity
Physics students need to know how to interpret velocity-time graphs that involve terminal velocity.
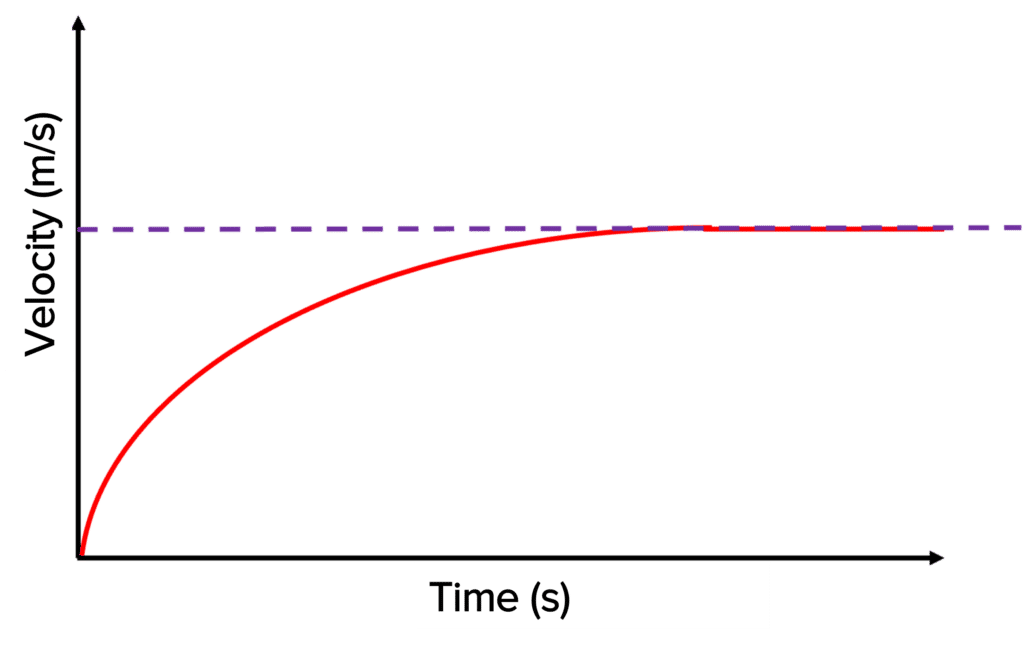
The acceleration of the object decreases as the drag force increases. This is shown where the graph levels out gradually, showing how the object’s acceleration is decreasing. The graph then becomes completely flat, showing the constant velocity has been reached. This is the terminal velocity.
Motion Graphs Example Questions
Question 1: State which graph that shows an object that starts stationary, accelerates and then travels at a constant speed.
[1 mark]
A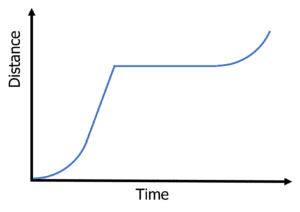 B
B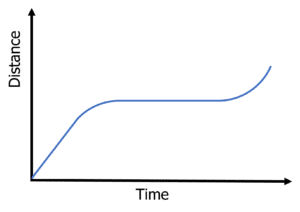 C
C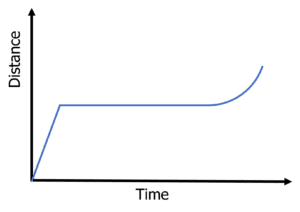 D
D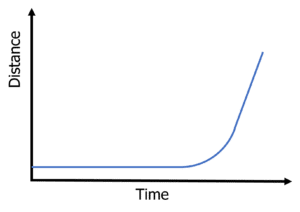
D
The flat horizontal line shows the object is not moving. The upwards curve shows acceleration and the straight steep section shows a constant speed.

Question 2: An car travels at a constant velocity of 45 \: \text{m/s}, and then decelerates until it is stationary. Use the velocity-time graph to calculate the distance the car travels.
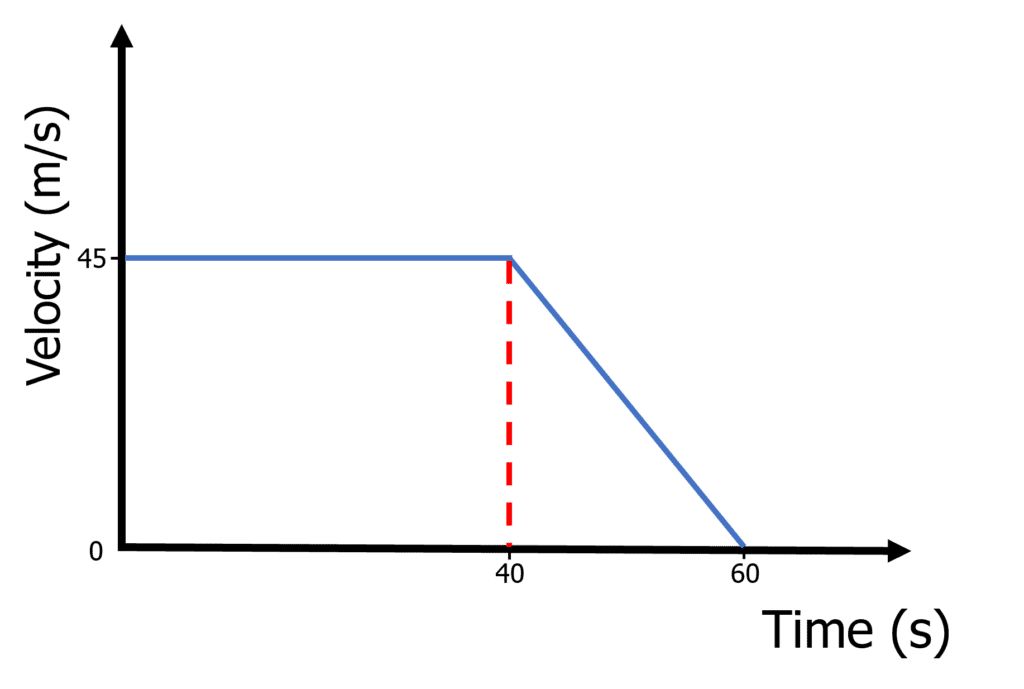
[3 marks]
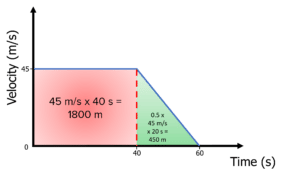
\text{area of rectangle} = 45 \:\text{m/s} \times 40 \: \text{s} = 1800 \: \text{m} \\ 60 \: \text{s} - 40 \: \text{s} = 20 \: \text{s} \\ \text{area of triangle} = \dfrac{1}{2} \times 45 \: \text{m/s} \times 20 \: \text{s} = 450 \: \text{m} \\ \textbf{total distance} \: \bold{ = 1800 }\bold{ + 450} \\ \bold{= 2250 \:} \textbf{m}
Question 3: State what type of motion the object is travelling in. Describe this motion with reference to the graph.

[4 marks]
- It is an object reaching it’s terminal velocity.
- The acceleration of the object decreases as the drag force increases. This is shown where the graph levels out gradually, showing how the object’s acceleration is decreasing.
- This acceleration decreases until the flat section, which shows a constant velocity. This is the terminal velocity.
Specification Points Covered
AQA GCSE:
- 4.5.6.1.4 The distance–time relationship
- 4.5.6.1.5 Acceleration