Velocity-Time Graphs
Velocity-Time Graphs Revision
Velocity-Time Graphs
A velocity-time graph (or speed-time graph) is a way of visually expressing a journey.
We are going to be using velocity-time graphs to find two things, primarily: total distance, and acceleration.
There are 5 key skills you need to learn
Make sure you are happy with the following topics before continuing:
Velocity-Time Graphs – Key things to remember:
With speed on the y-axis and time on the x-axis, a speed-time graph tells us how someone/something’s speed has changed over a period of time.
1) The gradient of the line = Acceleration
2) Negative gradient = Deceleration
3) Flat section means constant velocity (NOT STOPPED)
4) Area under the graph = Distance travelled

Skill 1: Describing a graph
One Skill you will need learn is describing a velocity time graph.
Example: The speed-time graph shows a 50-second car journey. Describe the 50 second journey.
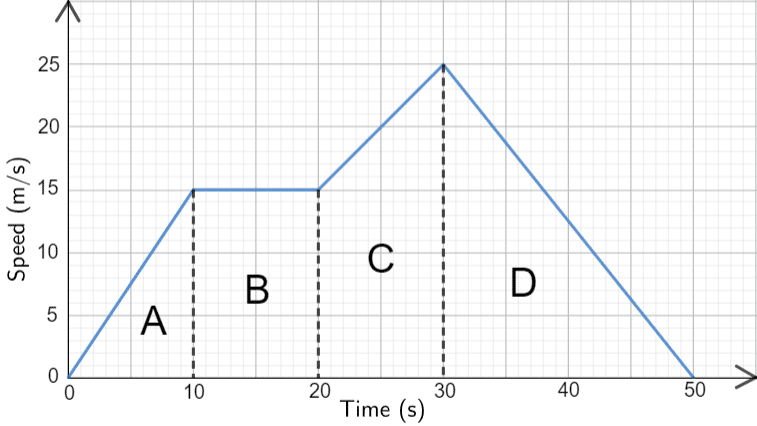
Step 1: Split the graph up into distinct sections, these can be seen in the image as A, B, C and D.
Step 2: In detail describe each part of the journey, ensuring to use numerical values throughout.
Section A – The car accelerated from 0 to 15 m/s over the first 10 seconds (because the line is straight, the acceleration is constant).
Section B – The line is flat, meaning the car’s speed did not change for 10 seconds – meaning it was moving at a constant speed.
Section C – The car accelerated up to 25 m/s over the next 10 seconds,
Section D – Finally it spent the last 20 seconds decelerating back down to 0 m/s.
Skill 2: Calculating Acceleration
Acceleration is calculated as the change in speed over time.


Example: The speed-time graph shows a 50-second car journey, find which section of the graph has the greatest acceleration.
We know,
The gradient of the line = Acceleration
We must find the gradient of the each section.
Section \bf{A}: Acceleration between 0s and 10s = gradient=\dfrac{15-0}{10-0}=1.5 m/s^2
Section \bf{B}: This section is flat, meaning the acceleration will be 0
Section \bf{C}: Acceleration between 20s and 30s = gradient =\dfrac{25-15}{30-20}=1 m/s^2
Section \bf{D}: Acceleration between 30s and 50s = gradient =\dfrac{0-25}{50-30}=\dfrac{-25}{20} = -1.25 m/s^2
Section \bf{A} has the largest acceleration, so the maximum acceleration is 1.5 m/s^2
Note: units of acceleration are expressed in distance/time\bold{^2}, which in this case is m/s\bold{^2}.
Skill 3: Calculating total distance travelled
Calculating the total distance travelled is one of the most common exam questions you may see.


Example: The speed-time graph shows a 50-second car journey, Calculate the total distance travelled over the 50 seconds.
we know,
Area under the graph = Distance travelled
To work out the area under this graph, we will break it into 4 shapes: A, B, C, and D.
This gives two triangles, a rectangle, and a trapezium, which are all shapes that we can work out the area of.
\text{A}=\dfrac{1}{2}\times10 \times15= 75 m
\text{B}=10\times15=150 m
C=\dfrac{1}{2}(15+25)\times10=200 m
D=\dfrac{1}{2}\times20\times25=250 m
Total distance travelled:
75+150+200+250=675 m
Skill 4: Average of curved graphs
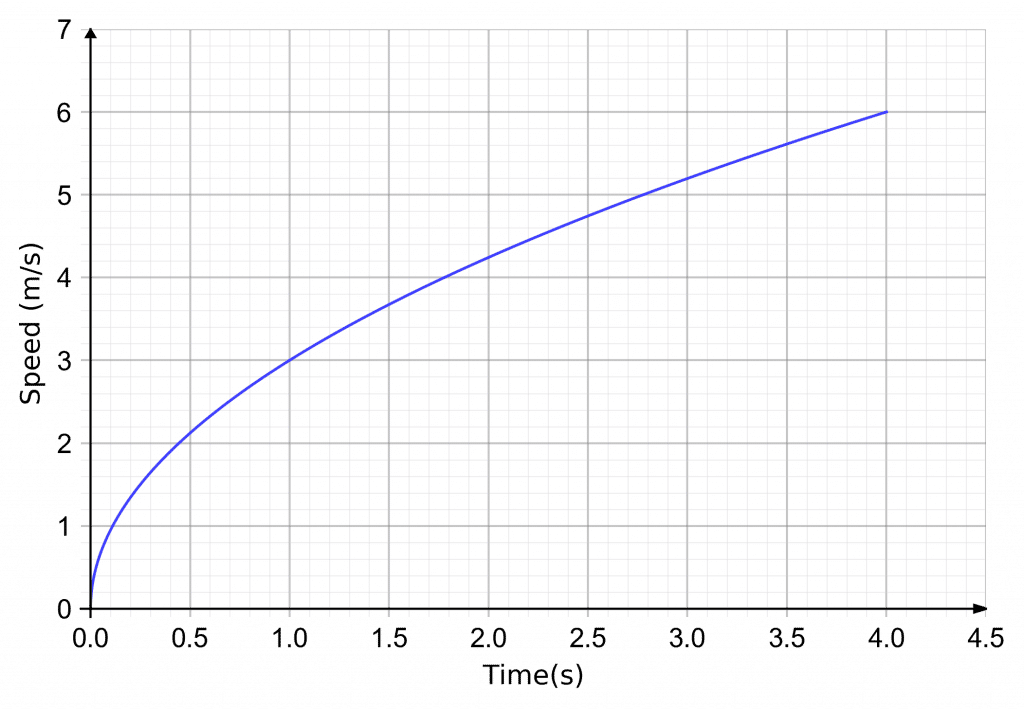

Finding the average gradient, is the gradient over a length of time.
Example: A speed-time graph of the first 4 seconds of someone running a race is shown.
Calculate the average acceleration over the 4 seconds.
We know:
The gradient of the line = Acceleration
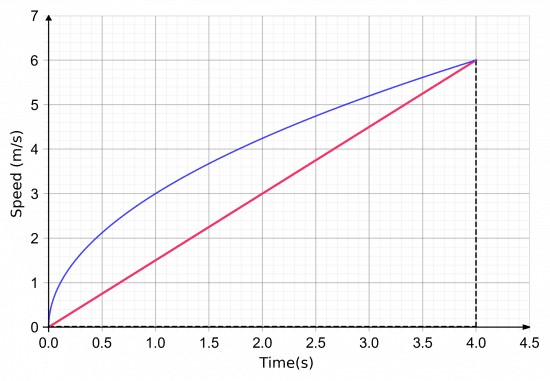
To work out the average acceleration over the 4 seconds, we will draw a line from where the graph is at 0 s to where the graph is at 4 s and find the gradient of it.
So, we get the average acceleration to be,
\text{gradient}=\dfrac{6-0}{4-0}=1.5 m/s^2
Skill 5: Instantaneous gradient of a curve


Finding the instantaneous gradient, is the gradient of the tangent at a point.
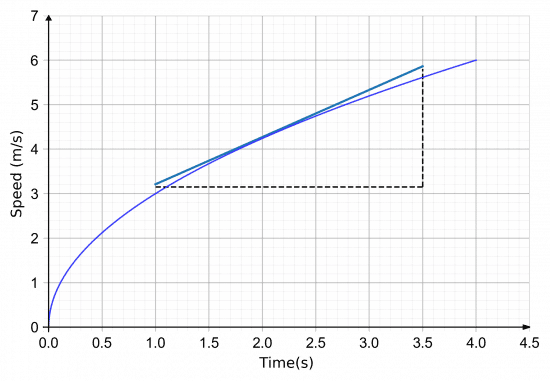
Example: A speed-time graph of the first 4 seconds of someone running a race is shown.
Calculate the instantaneous acceleration 2 seconds in.
To do this we will draw a tangent to the line after 2 seconds and work out the gradient of that. This is shown above.
Then, we get the instantaneous acceleration to be,
\text{gradient}=\dfrac{5.8-3.2}{3.5-1.0} = 1.04 m/s^2 (3 sf).
Velocity-Time Graphs Example Questions
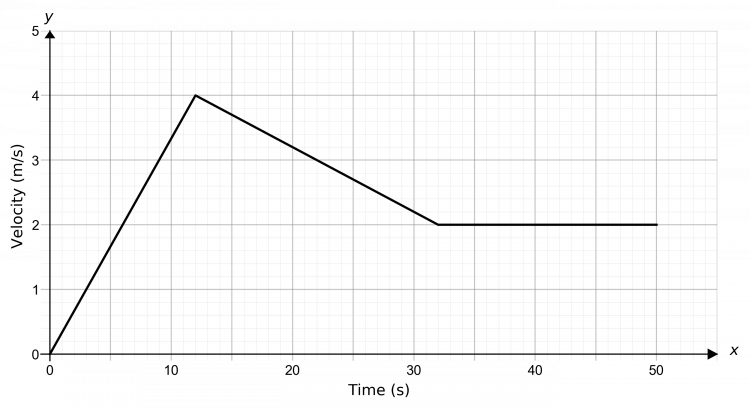
Question 1: A ball is placed at rest at the top of a hill. It travels with constant acceleration for the first 12 second and reaches a speed of 4 m/s. It then decelerates at a constant rate of 0.1 m/s^2 for 20 seconds. It then travels at a constant speed for a further 18 seconds.
[4 marks]
Draw a speed-time graph for the ball over the course of this 50 seconds.
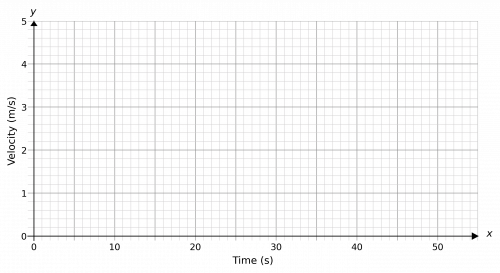
So, we will firstly draw a straight from the origin to (12, 4), since after 12 seconds, it’s reached 4 m/s. Then, for the next part we’re told the deceleration is 0.1 m/s^2 for 20 seconds. So, if the speed decreases by 0.1 every second, after 20 seconds it will be
0.1 \times 20=2 m/s
Therefore, by 32 seconds in the speed is 2 m/s, so we will draw a straight line from (12, 4) to (32, 2). Finally, a constant speed will be represented by a flat line that goes until the 50 second point, still at 2 m/s. The result should look like the graph below.
Question 2: Below is a speed-time graph of a track cyclist during a race. Work out the total distance travelled by the cyclist over the course of the race.
[3 marks]
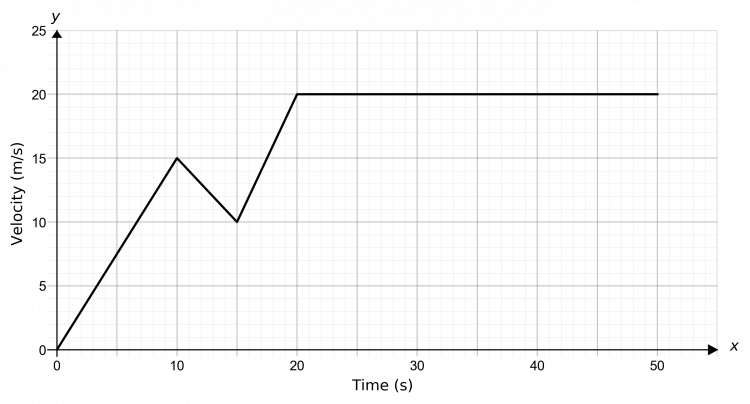
We need to find the area underneath the graph. To do this, we will split it up into shapes we know how to calculate the area of, as seen below.
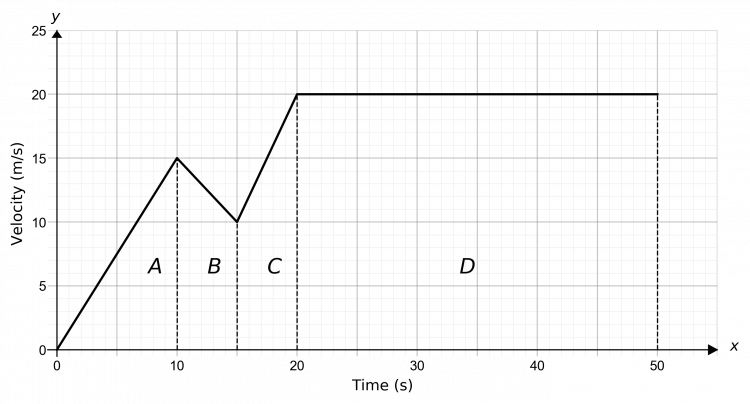
A is a triangle, B and C are trapeziums, and D is a rectangle. So, we get
\text{A}=\dfrac{1}{2}\times10\times15=75 m
\text{B}=\dfrac{1}{2}\times(10+15)\times5=62.5 m
\text{C}=\dfrac{1}{2}\times(10+20)\times5=75 m
\text{D}=30\times20 = 600 m
Therefore, the total distance travelled by the cyclist is
75+62.5+75+600=812.5 m
Question 3: Below is a speed-time graph of a runner during the first 50 seconds of a race. Work out the average acceleration of the runner during this period.
[2 marks]
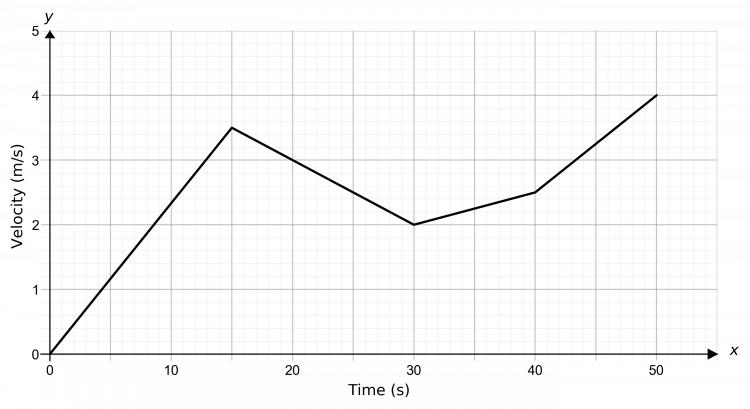
In order to determine the average acceleration, we draw a line from the origin to the endpoint of the graph, as seen below. The average acceleration is given by the gradient of this line.
Hence the average acceleration is,
\text{gradient}=\dfrac{4-0}{50-0}= 0.08 m/s^2


