
Revise

Drawing Straight Line Graphs
Drawing Straight Line Graphs
When asked to draw a straight line, there are 2 methods you can use, but it’s good to know both.
- Using a table/list of coordinate values the line passes through, or
- Using the equation of the line, in the form .
Make sure you are familiar with the following topics before continuing:

Method 1: Table of Values Method
The table of values method involves calculating values of for different values of .
Example: Draw a graph for the line .
Step 1: Construct a table with suitable values
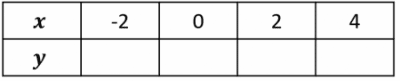
Step 2: Find the values of for each value.
To work out the missing values, we use the equation like a formula, substituting the values from the table in, we get the following:
When , we get
When , we get
When , we get
When , we get

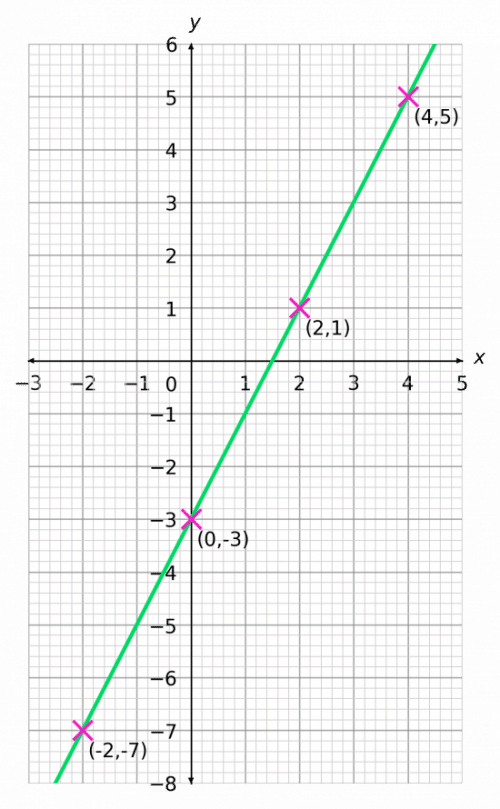
Step 3: So, we know that the line passes through
and
Now all that remains is to plot them on a pair of axes and draw a straight line through them. The result should look like the graph below.

Method 2: Using
You can use to plot a straight line graph.
Example: Plot the straight-line graph with equation .
Rearranging this equation to be in the form , by subtracting from each side
Then, divide both sides by , to get it in the form :
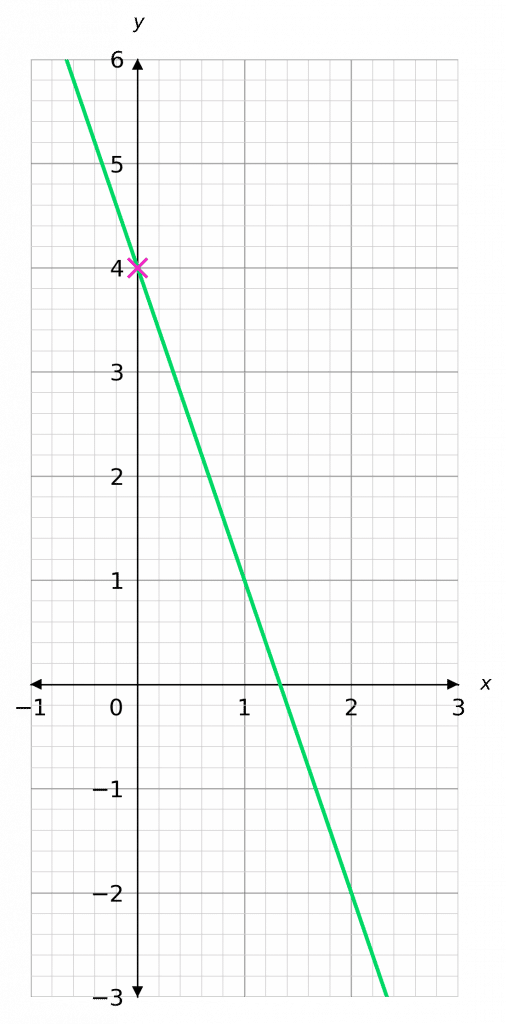
So, the -intercept is , and the gradient is – so each time increases by , decreases by
Drawing Straight Line Graphs Example Questions
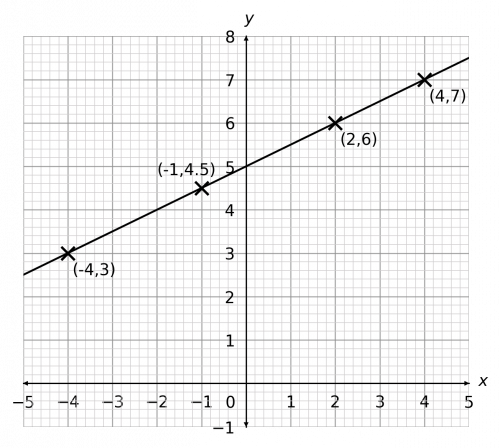
Question 1: Below is a table of coordinates of the line . Complete the table, then plot the points and the straight-line.
[2 marks]

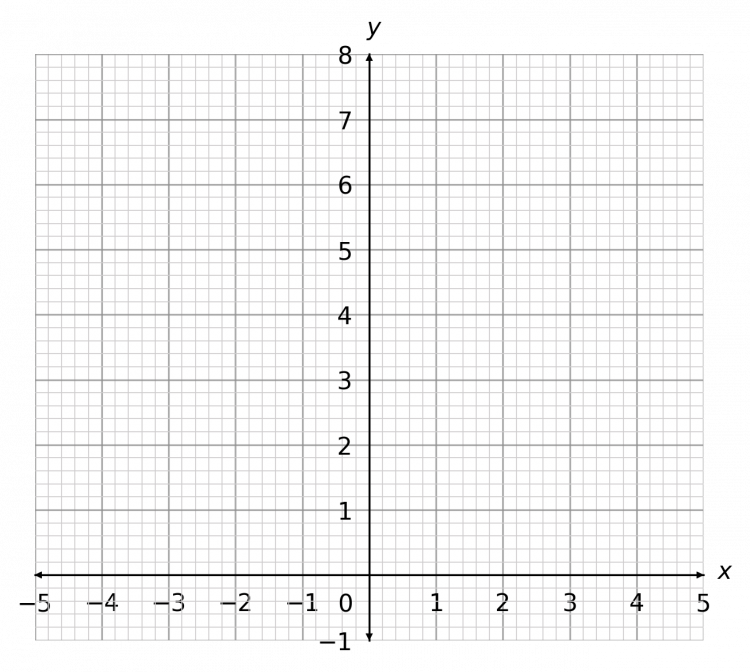
To find the missing value, substitute the given values into the equation.
When , we get
When , we get
When , we get
Subtract from both sides of this equation to get
Multiplying both sides by , we immediately get . The completed table looks like:

Plotting these points and using them to draw the graph should look like:


Question 2: Plot the graph of the equation
[2 marks]
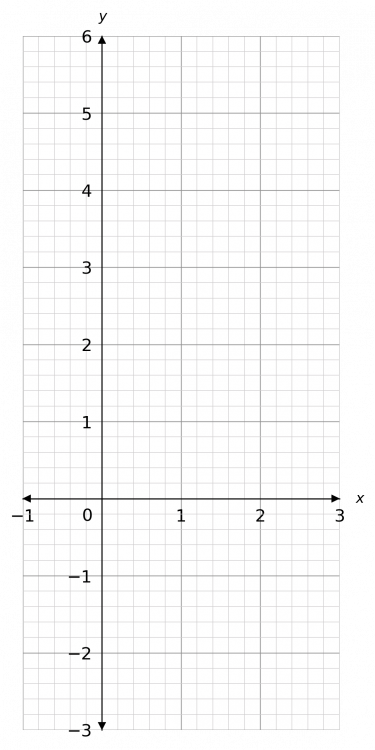
Let’s rearrange this equation. Subtract from both sides:
Then, divide both sides by :
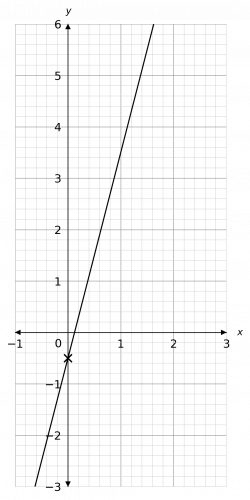
So, the -intercept is , and the gradient is – so each time increases by , increases by .
This is enough information to draw the graph. The result should look like the figure below.
Question 3: Plot the graph of the equation
[2 marks]
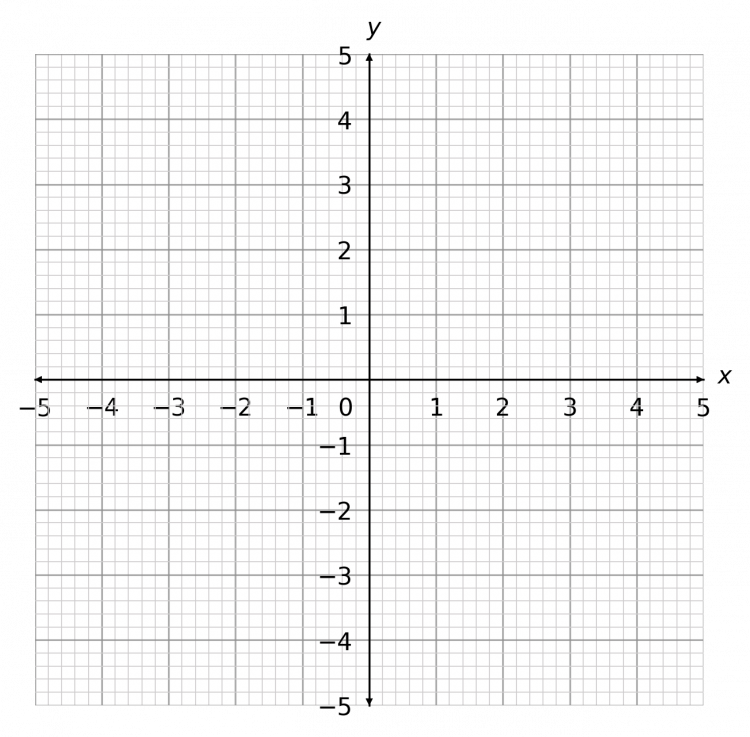
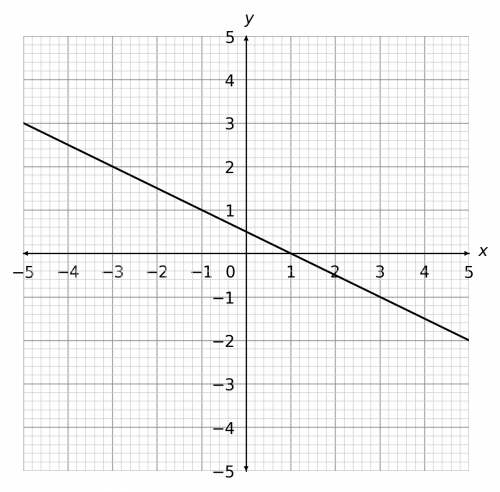
Rearranging this equation to be in the form , by adding to both sides,
So, the -intercept is , and the gradient is – so each time increases by , decreases by
The result should look like the figure below.
Question 4: Plot the graph of the equation
[2 marks]
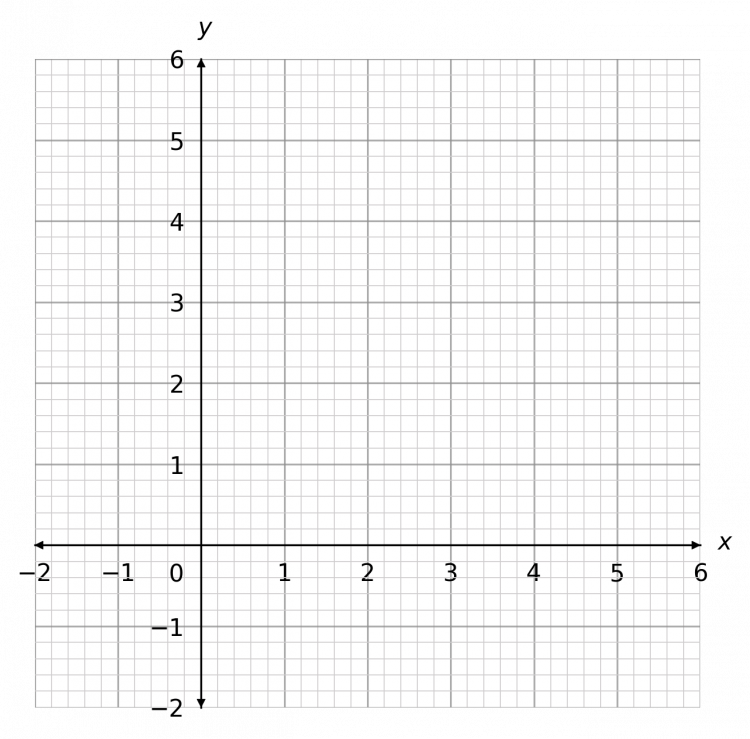
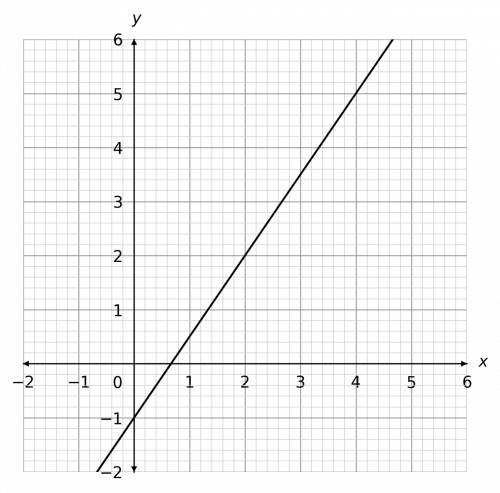
We can rearrange this equation by subtracting from both sides:
Then, dividing both sides by :
So, the -intercept is , and the gradient is – so each time increases by , increases by
The result should look like the figure below.
Question 5: Plot the graph of the equation
[2 marks]
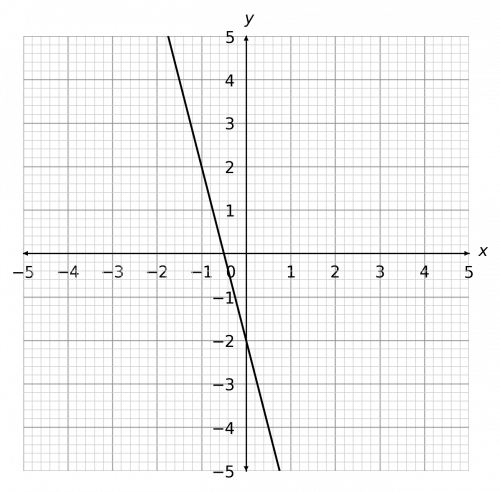
We can rearrange this equation by subtracting from both sides:
So, the -intercept is , and the gradient is – so each time increases by , decreases by
The result should look like the figure below.
Specification Points Covered
Algebra – 9. plot graphs of equations that correspond to straight-line graphs in the coordinate plane; use the form to identify parallel and perpendicular lines; find the equation of the line through two given points, or through one point with a given gradient
Drawing Straight Line Graphs Worksheet and Example Questions

(NEW) Drawing Straight Line Graphs Exam Style Questions - MME
Level 1-3GCSENewOfficial MMEDrawing Straight Line Graphs Drill Questions
Straight Line (2)
Level 1-3GCSE