Area Under a Graph
Area Under a Graph Revision
Area Under a Curve
Velocity-time graphs that are made up of straight lines are easy to split up into regular shapes to calculate the area.
Area Under Velocity Time Graph = Total Distance Travelled
However, if the graph is curved then the area must be approximated by using triangles, rectangles and trapeziums and their respective area formulas.
Make sure you are happy with the following topics before continuing:
Estimating Area using Triangles and Trapeziums
Below is a speed-time graph. Use equal width shapes to find an approximation for the total distance travelled.
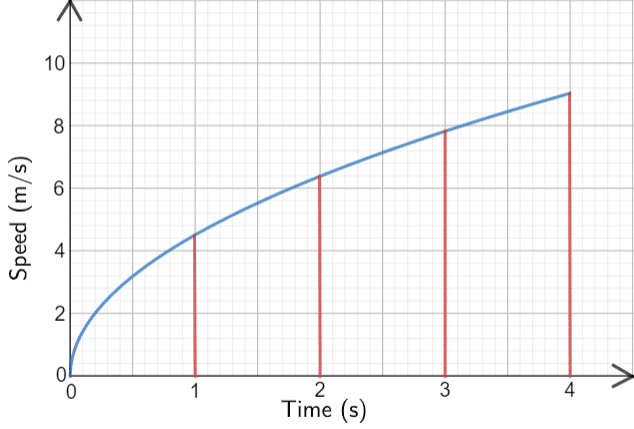
Given that we’re looking for the area under the graph in the first 4 seconds, we will use a width of \bf{1} second on the \bm{x}-axis.
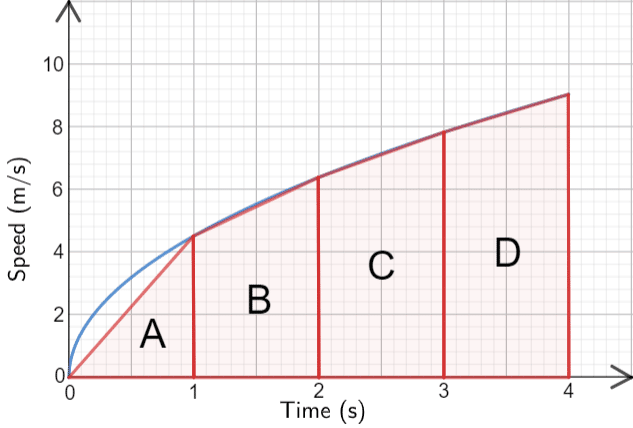
We can estimate the area fairly accurately by using a triangle, shape \bf{A} and three trapeziums, shapes, \bf{B}, \bf{C} and \bf{D}.
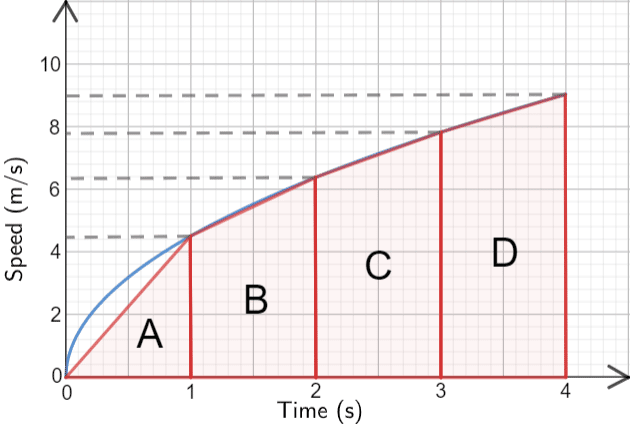
Now all we have to do is to find the area of all 4 shapes.
Shape \bf{A}: Is a triangle,
\text{Area of A }= \dfrac{1}{2} \times \text{base} \times \text{height} = \dfrac{1}{2}\times 1 \times 4.4=2.2
Shape \bf{B}: Is a trapezium.
\text{Area of B } = \dfrac{1}{2}(a+b)h = \dfrac{1}{2}\times (4.4+6.4) \times 1=5.4
Shape \bf{C}: Is a trapezium.
\text{Area of C }=\dfrac{1}{2}\times (6.4+7.8) \times 1=7.1
Shape \bf{D}: Is a trapezium.
\text{Area of D }=\dfrac{1}{2}\times (7.8+9) \times 1=8.4
Therefore, for our final estimate for the area under the graph we add together the area of each shape, and so the distance travelled is
2.2+5.4+7.1+8.4=23.1 m
Note: Because of the way we calculate this estimate, people’s answers will naturally vary a little, but this doesn’t mean they’re wrong. In an exam, there will be a range of answers that you will receive full marks for, you just have to try to be as accurate as you can with your estimate.
Area Under a Graph Example Questions
Question 1: Below is a speed-time graph of a race car accelerating. Using 4 strips of equal width, estimate the distance the car travelled over the course of the 20 seconds.
[2 marks]
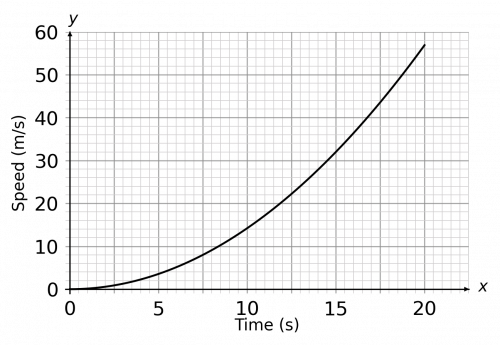
We’ll need 4 strips of equal width over the course of 20 seconds. 20\div 4=5, so each strip must be 5 seconds wide on the x-axis. We start by drawing vertical lines every 5 seconds going from the x-axis up to the graph.
Then, connecting each of the points where those vertical lines meet the graph, we get our 4 strips: 3 trapeziums and 1 triangle. Lastly, drawing some horizontal lines from the ‘corners’ of our trapeziums to ensure we can read off the y-values, our picture should look like the graph below.
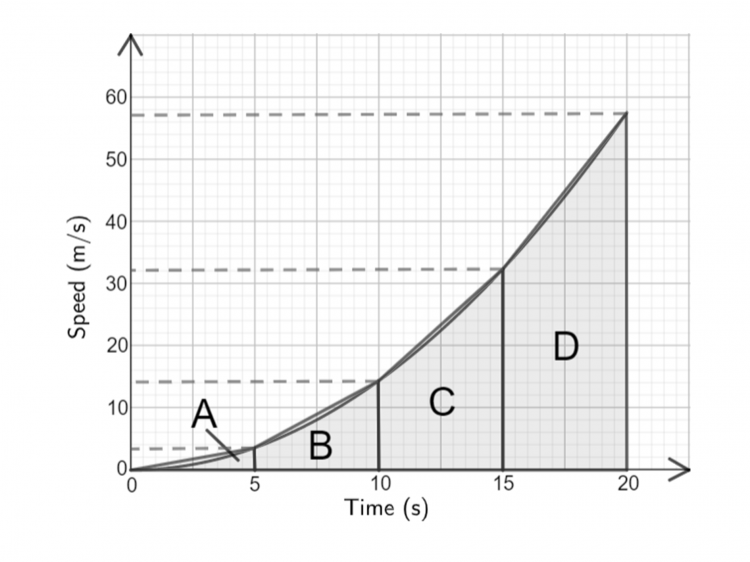
For ease, we’ve labelled the four shapes that we going to find the areas of with the letters A, B, C, and D. Shape A is a triangle, so reading the y-value from the graph we get
\text{Area of A }=\dfrac{1}{2}\times 5 \times 3.5=8.75
The other 3 shapes are trapeziums. Reading the remaining y-values from the graph, we get
\text{Area of B }=\dfrac{1}{2}\times (3.5+14)\times 5=43.75
\text{Area of C }=\dfrac{1}{2}\times (14+32)\times 5=115
\text{Area of D }=\dfrac{1}{2}\times (32+57)\times 5=222.5
Now, adding up the results, we get the estimate of the distance travelled to be
8.75+43.75+115+222.5=390 m.
Note: Any answer between 385 m and 395 m is acceptable in this case.
Question 2: Below is a speed-time graph of a motorcycle. Using 3 strips of equal width, estimate the distance travelled by the motorcycle from t=5 to t=8.
[2 marks]
We’ll need 3 strips of equal width over the course of 3 seconds, so each strip must be 1 second wide on the x-axis. We start by drawing vertical lines every second, between 5 s and 8 s, going from the x-axis up to the graph.
Then, connecting each of the points where those vertical lines meet the graph, we get our 3 strips: all trapeziums. Lastly, drawing some horizontal lines from the ‘corners’ of our trapeziums to ensure we can read off the y-values, our picture should look like the graph below.
For ease, we’ve labelled the three shapes that we going to find the areas of with the letters A, B, and C. All 3 are trapeziums of “height” 1, so, reading the y-values from the graph we get
\text{area of A }=\dfrac{1}{2}\times (19+25)\times 1=22
\text{area of B }=\dfrac{1}{2}\times (25+20)\times 1=22.5
\text{area of C }=\dfrac{1}{2}\times (20+10)\times 1=15
Now, adding up the results, we get the estimate of the distance travelled to be
22 + 22.5 + 15 = 59.5 m.
Note: Any answer between 59 m and 60 m is acceptable in this case.


