
Revise
Osmosis
Osmosis
Osmosis is the diffusion of water across a partially permeable membrane and allows cells to gain and lose water as required.
What is Osmosis?
Osmosis is just like diffusion but is specifically just water and you will need to learn its definition.
Osmosis is the movement of water molecules across a partially permeable membrane, from a region of high water concentration to low.
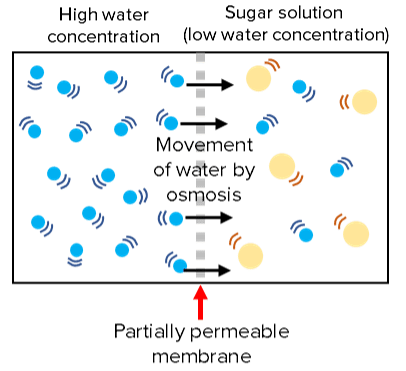
Membranes are partially permeable which means large molecules cannot pass through them, only certain small molecules such as water.
Water can move both ways across the membrane but which way it moves is dictated by concentration of water on either side.
There will be a net movement of water from an area of high water concentration to low water concentration.
For example water will diffuse into a sugar solution and dilute it because it has low water concentration.
Osmosis requires no cellular energy.

Required Practical
Effect of different salt/sugar concentrations on the mass of plant tissue.
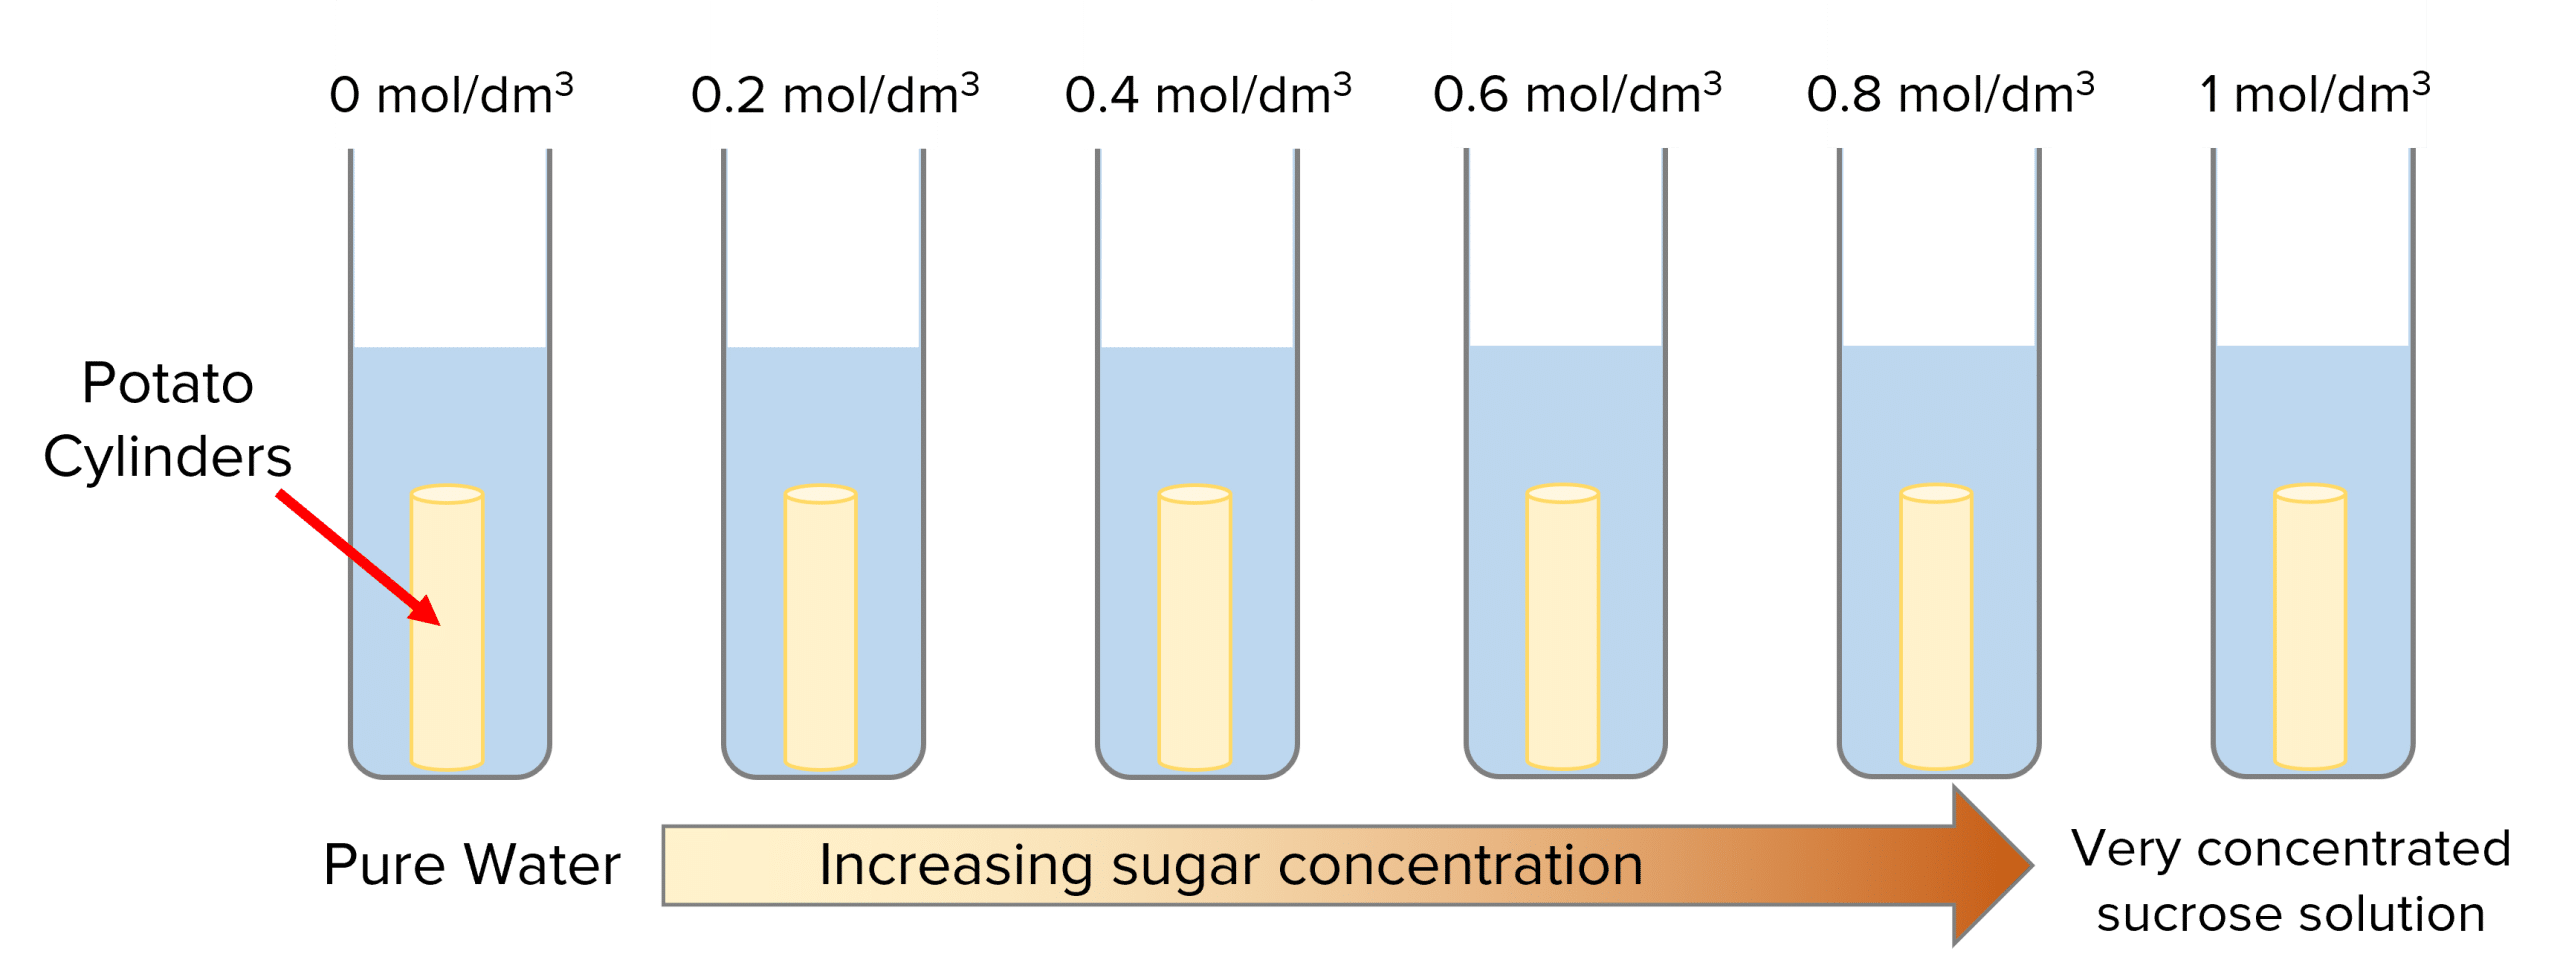
This experiment can be carried out with different vegetables and with salt or sugar solutions. This example uses pieces of potato in sucrose solutions.
Doing the experiment
- Set up test tubes containing 10\text{ cm}^3 of different sucrose solutions. They should all have different concentrations, ranging from pure water (control) to very concentrated solution \text{(}1\text{ mol/dm}^3\text{)}.
- Prepare the potato by cutting it into cylinders of equal size using a cork borer. Then measure and record their masses in grams using a balance.
- Place a potato cylinder in each beaker and leave them for 24\text{ hours} (remembering which potato cylinder went in which test tube).
- Take the cylinders out of the solutions, dry them with a paper towel and measure and record their masses again.
You may wish to repeat the experiment at each sucrose concentration with different potato cylinders to identify anomalous results and make the results more reliable by calculating mean values.
The independent variable is the concentration of sucrose solutions.
The control variables include the volume of sucrose solution, time, temperature and type of sugar used.
Analysing the results
Look through your recorded masses and notice whether the potato masses increased or decreased after being in the different sugar solutions. If the mass increased, then water has moved into the potato cells by osmosis. If the mass decreased, the water has moved out of the potato cells by osmosis. You can calculate the rate of water uptake/loss for each potato cylinder using this equation:
\text{rate of change (grams/hr)} =\dfrac{\text{change in mass}}{24 \text{ (hr)}}
Next you can calculate the percentage change in mass for each potato cylinder. This will allow you to compare the effects of osmosis in each test tube, even if the potato cylinders had different starting masses. If this value is positive, the mass of the potato will have increased, if it is negative, the mass of the potato will have decreased:
\text{percentage change mass} =\dfrac{\text{final mass} - \text{original mass}}{\text{original}}\times 100
To display the results and work out the concentration of sucrose inside the potato you can plot the percentage change in potato mass (y-axis) against the concentration of sucrose solution (x-axis). The concentration of sucrose inside the cell is where the line of best fit crosses the x-axis.
Example:
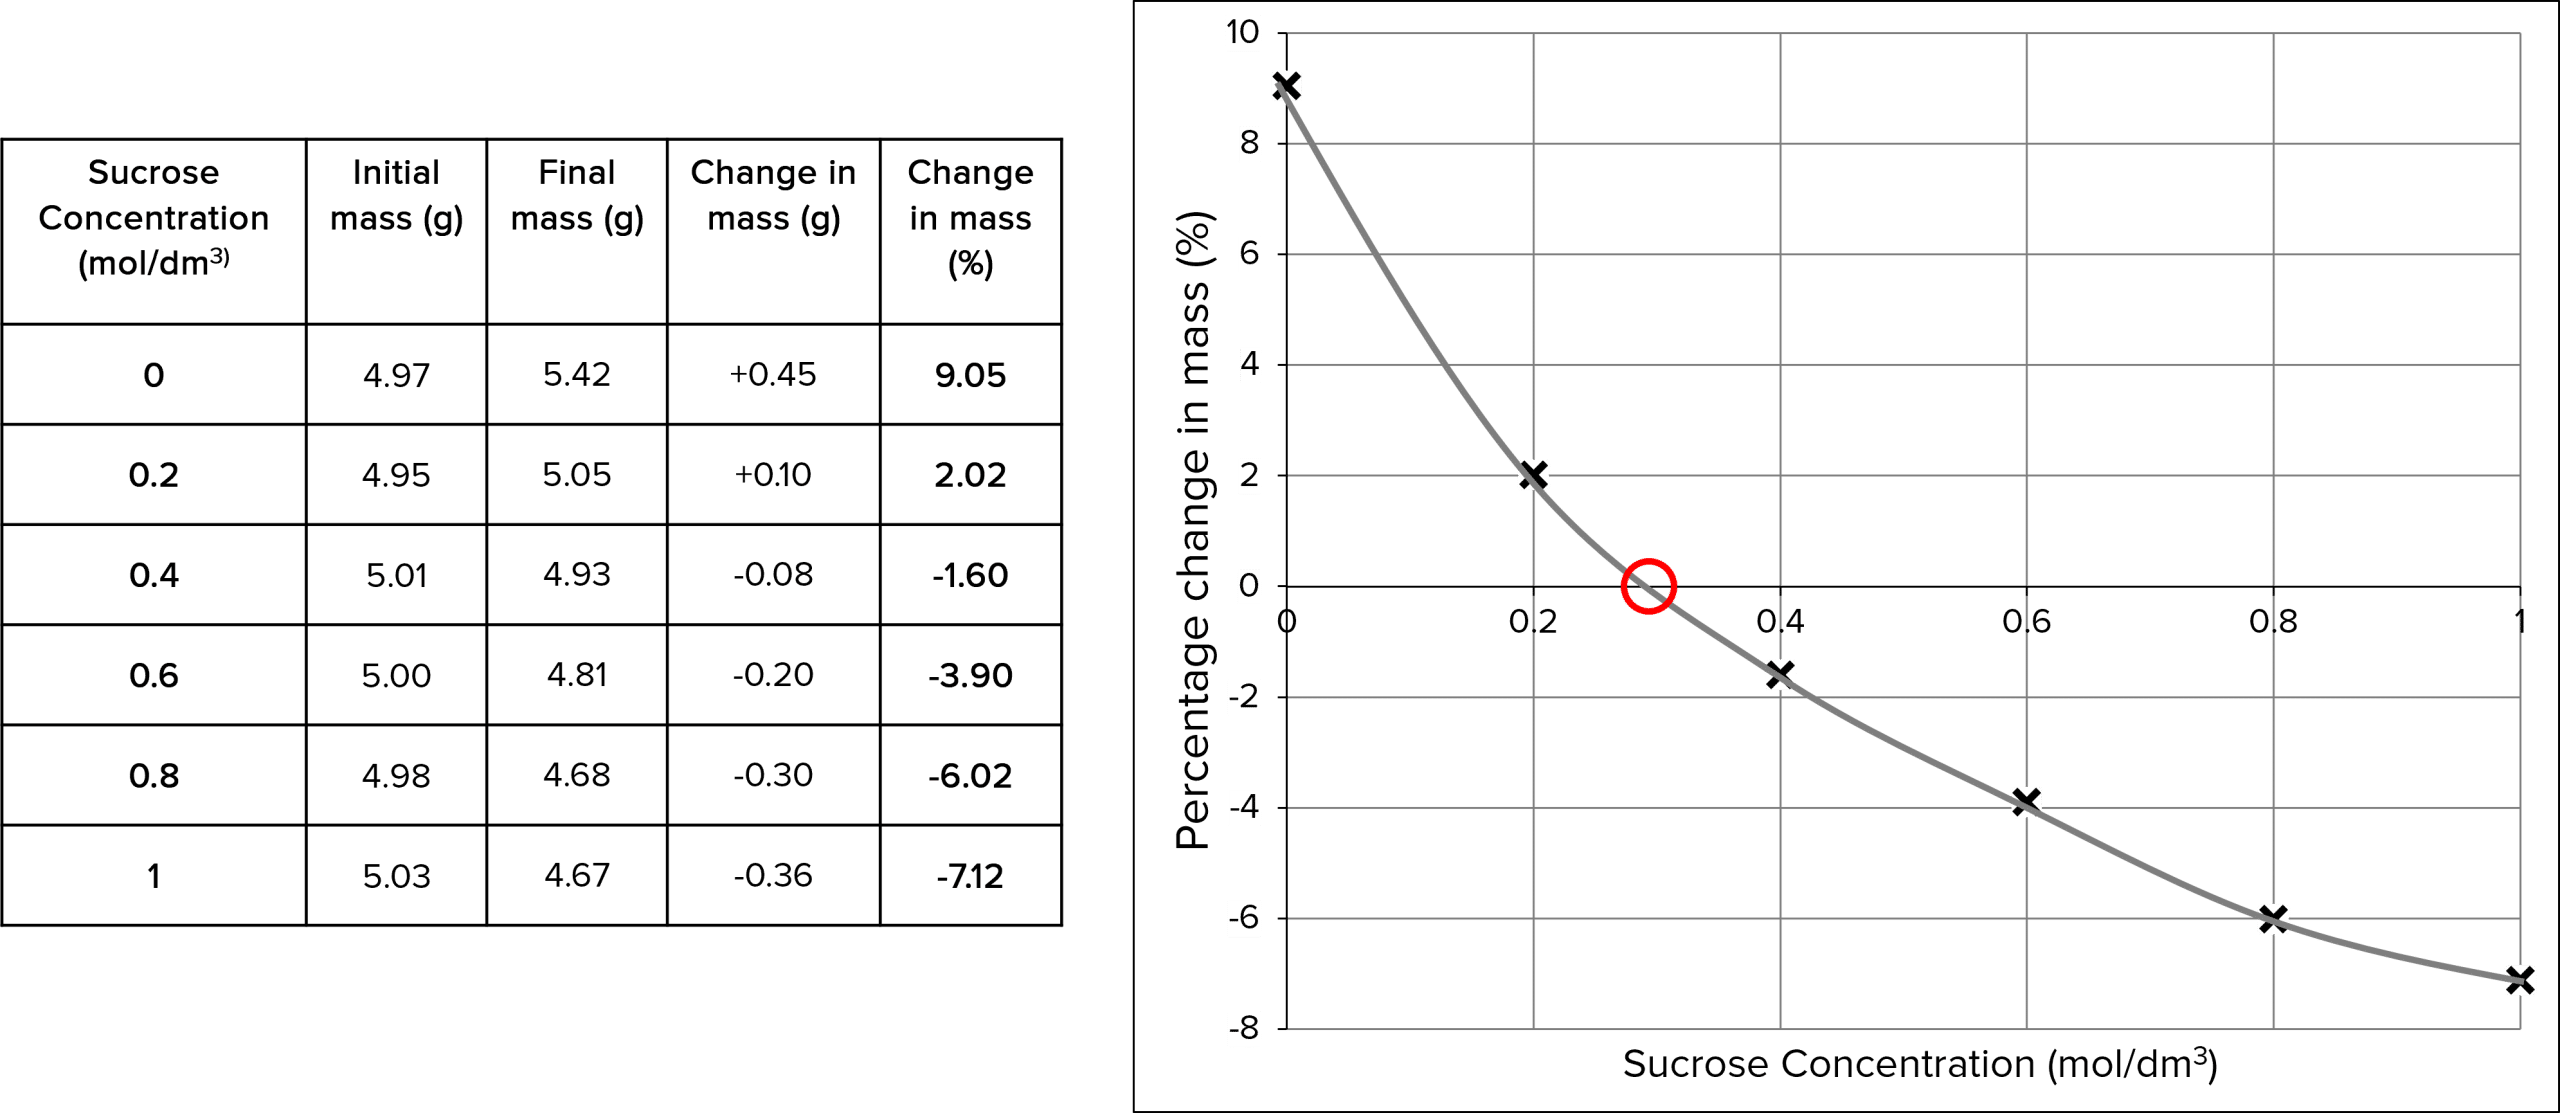
The concentration of sucrose inside the potato is 0.3\text{ mol/dm}^3 because there is no net movement of water.

Osmosis Example Questions
Question 1: What is Osmosis?
[3 marks]
Osmosis is the movement of water molecules from an area of high water concentration to low water concentration, across a partially permeable membrane.

Question 2: Describe how you would carry out an experiment to work out the sucrose concentration in carrot.
[6 marks]
- Set up test tubes containing different concentrations of sucrose solution (including one with pure water, as a control).
- Slice carrot into equal sized pieces and measure their masses.
- Place a piece of carrot in each test tube and leave over night/for some time.
- Dry and weigh the carrot pieces again.
- Calculate the percentage change in mass for each carrot piece and plot it on a graph (y-axis) against the concentration of sucrose (x-axis).
- Draw a line of best fit and observe where it crosses the x-axis. This is the concentration of sucrose inside the carrot.
Question 3: When carrying out scientific investigations, why should you repeat experiments?
[3 marks]
It gives you more reliable results because you can identify and remove anomalies and enables you to calculate accurate mean values.
Specification Points Covered
AQA GCSE-
4.1.3.2 Osmosis
Osmosis Worksheet and Example Questions
Osmosis Questions
GCSEOfficial MME