
Revise
Comparing Results
Comparing Results Worksheets, Questions and Revision
It is important to be able to compare results of experiments. This can help you to evaluate hypotheses and come to reliable conclusions.
Percentage Change
When investigating how a dependent variable changes over time, we can use the percentage change to compare results that didn’t have the same initial value. For example, if you wanted to measure the change in height of a group of plants, they would not all start at the same height.
The percentage change can be calculated can be calculated by the following equation:
\% \text{ change} = \dfrac{\text{final value}-\text{start value}}{\text{start value}} \\ \times 100
- \% \text{ change}= percentage change
- \text{final value}= the value at the end of the experiment
- \text{start value}= the value at the beginning of the experiment

Percentiles
Percentiles are used to compare single pieces of data to the rest of the data set.
To calculate a percentile, you order the data from smallest to largest and divide the range into 100 sections. Each of these sections is one percentile of the data.
Percentiles can be illustrated in a diagram such as the one below:
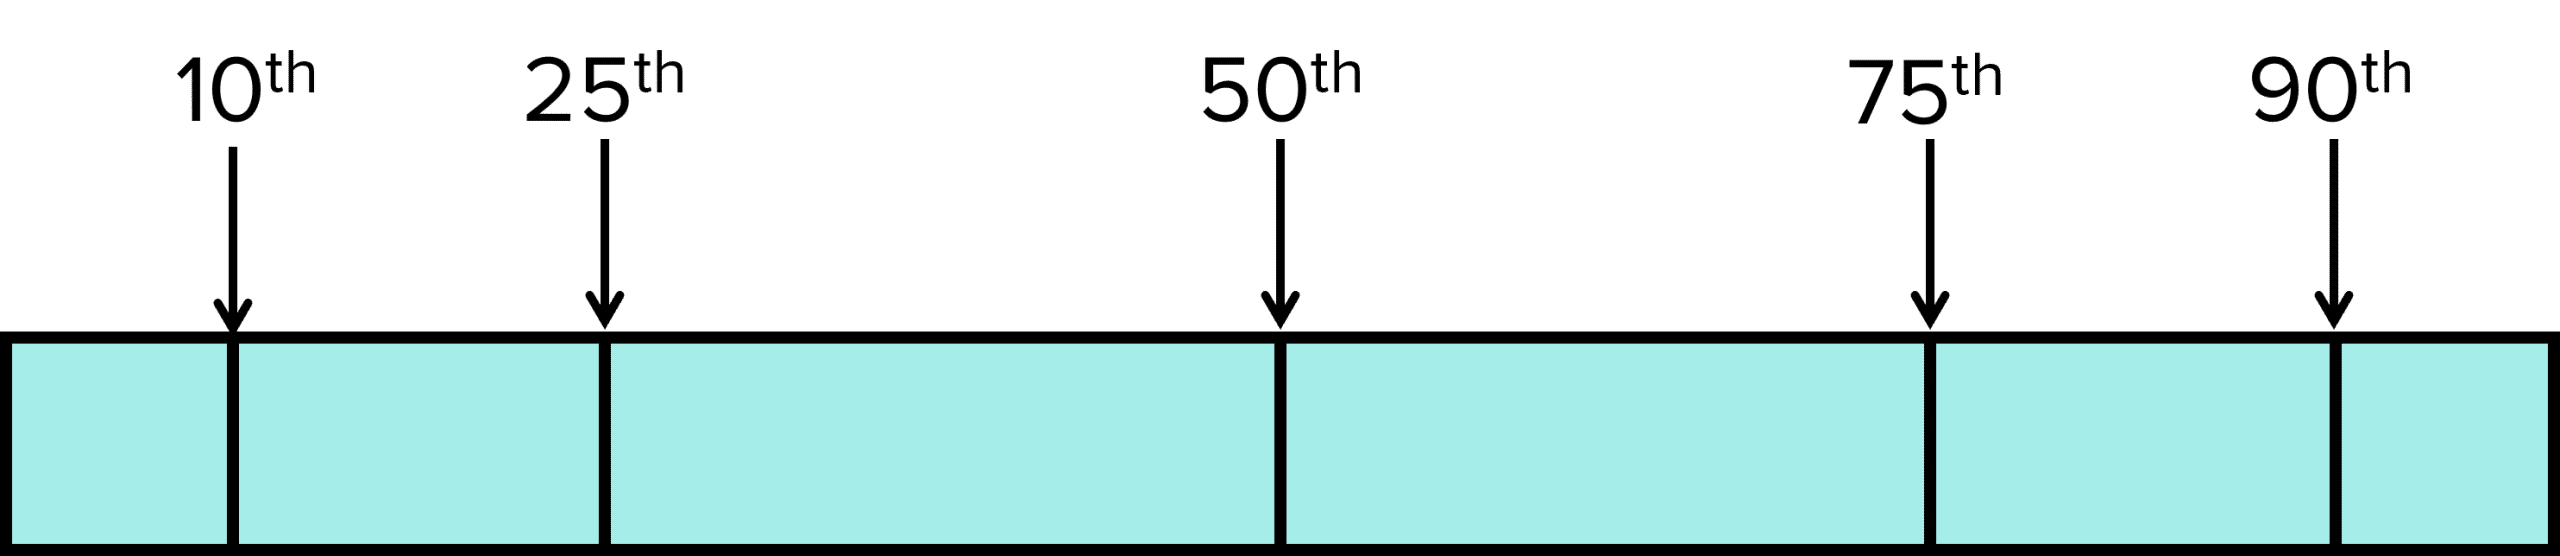
For example, if a value is in the 50^{\text{th}} percentile of the data, there are equal number of pieces of data above and below it.
If a value is in the 90^{\text{th}} percentile of the data, only 10 \% the the data points are above it.
By calculating the range between the 10^{\text{th}} and 90^{\text{th}} percentiles, you can determine a range that ignores outliers.

Example 1: Calculating Percentage Change
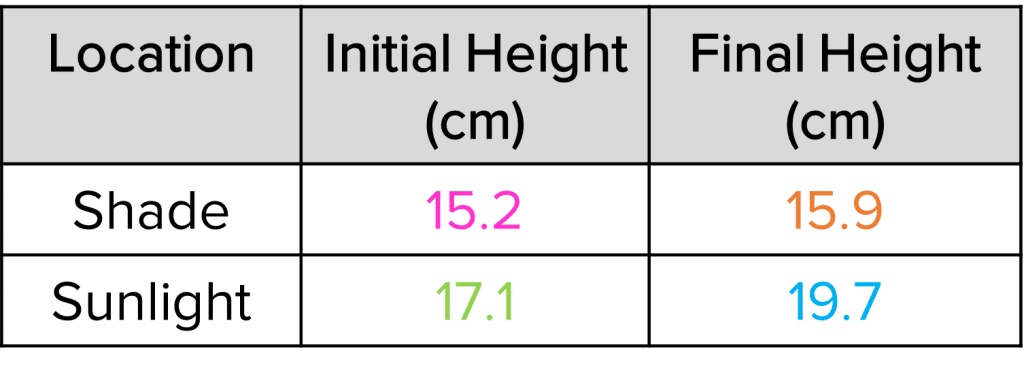
A student is investigating how well plants grow under different light conditions. He places one plant in the shade and one plant in bright sunlight. He measures the height of the plants at the beginning of the experiment and after 2 \text{ days}. The table on the right hand side shows the student’s results.
Calculate the percentage change in the height of the plants. Use your results to make a conclusion about the effect of sunlight on the growth of plants.
[3 marks]
\% \text{ change} = \dfrac{\text{final value}-\text{start value}}{\text{start value}} \times 100
Shaded plant:
\% \text{ change} = \dfrac{\textcolor{f95d27}{15.9}-\textcolor{f21cc2}{15.2}}{\textcolor{f21cc2}{15.2}} \times 100 = \bold{4.6 \%}
Sunlight:
\% \text{ change} = \dfrac{\textcolor{10a6f3}{19.7}-\textcolor{7cb447}{17.1}}{\textcolor{7cb447}{17.1}} \times 100 = \bold{15.2 \%}
Therefore, we can conclude that the presence of sunlight increases the growth of plants.
Example 2: Percentiles

A student measures the length of all of the pencils in their pencil case. They record the results in the table on the right.
Calculate the range of lengths from the 10^{\text{th}} to the 90^{\text{th}} percentiles.
[3 marks]
First, put the lengths in order from smallest to largest:

There are 10 measurements and so each represents 10 \% of the data. So the 10^{\text{th}} percentile is between the first two values and the 90^{\text{th}} percentile is between the last two values.
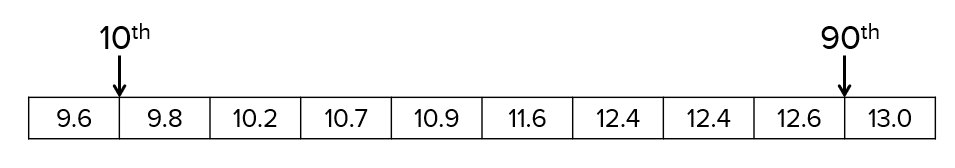
90^{\text{th}} \text{ percentile}= \dfrac{12.6+13.0}{2} = \bold{12.8} \textbf{ cm}
\text{range}=12.8-9.7 = \bold{3.1} \textbf{ cm}
Comparing Results Example Questions
Question 1: When is it useful to calculate the percentage change?
[2 marks]
When you want to compare results that didn’t have the same initial value.

Question 2: A student collects rainwater for an experiment. On the first day, they collect 25 \text{ cm}^3 and on the second day they collect 29 \text{ cm}^3. Calculate the percentage change in the amount of water collected.
[2 marks]
Question 3: Find the 75^{\text{th}} percentile of the following times recorded by a scientist:

[2 marks]
Put the data in order from smallest to largest:

There are 5 pieces of data so each represents 20 \%.
So the 75^{\text{th}} percentile is in the fourth value.
(0 \%-20\%=9 \text{ s, } 20 \% -40\% = 10 \text{ s, } 40 \% -60 \% = 10 \text{ s, } 60 \% -80 \% = 12 \text{ s and } 80 \%-100 \% = 13 \text{ s}).
So the answer is \bold{12} \textbf{ s}