Energy Levels and Photon Emission
Energy Levels and Photon Emission Revision
Energy Levels and Photon Emission
To understand the photoelectric effect in more detail, we have to understand what is happening at an atomic level. When an incident photon collides with the surface of a photoemissive surface (i.e a metal), the electrons of the atoms gain energy causing a chain reaction to occur.
Excitation, De-excitation and Ionisation
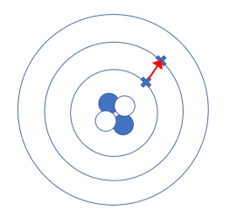

When a photon collides with a photoemissive surface, it collides with the electrons in the energy levels of the atom. During this collision, the electron gains energy.
As a consequence, the electron jumps from one energy level to an outer energy level. In the diagram on the right, the electron has jumped one energy level. When this happens, the atom is in an excited state and the process is known as excitation. If the photon had sufficient energy, it may cause the electron to jump up more than one energy level.
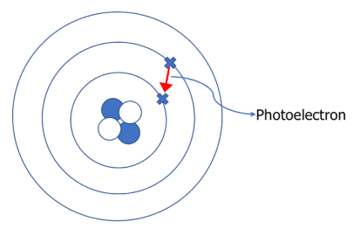

However, when the atom is in an excited state as above, the atom is very unstable. So almost instantly, the electron jumps back down to its original energy level in a process called de-excitation.
When the atom de-excites, it emits a photoelectron with the same amount of energy as the difference between the two energy levels (see energy level diagrams).
If an electron gains enough energy from the collision to move beyond the outermost energy level, the electron is then free from the attraction of the nucleus. This is known as ionisation. As a result the atom has now become a positive ion.
Energy Level Diagrams
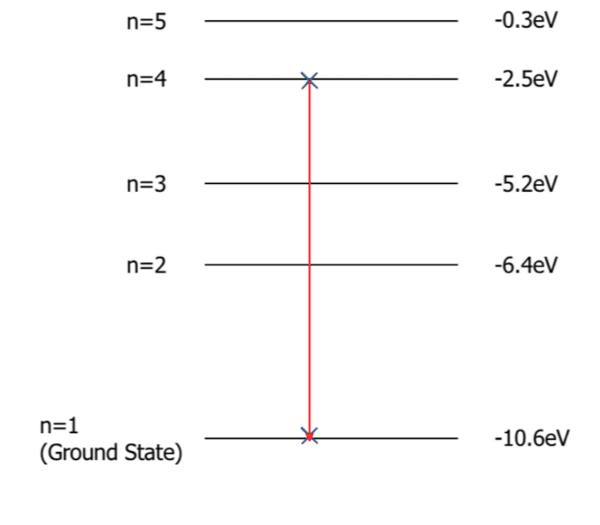
Energy level diagrams can be used to represent the energy of electrons in each of the electrons’ energy levels. They can also be used to calculate how much energy a photoelectron has after the de-excitation of an electron. On the right is an example of an energy level diagram. It is important to note that each element has its own specific energy level diagram.
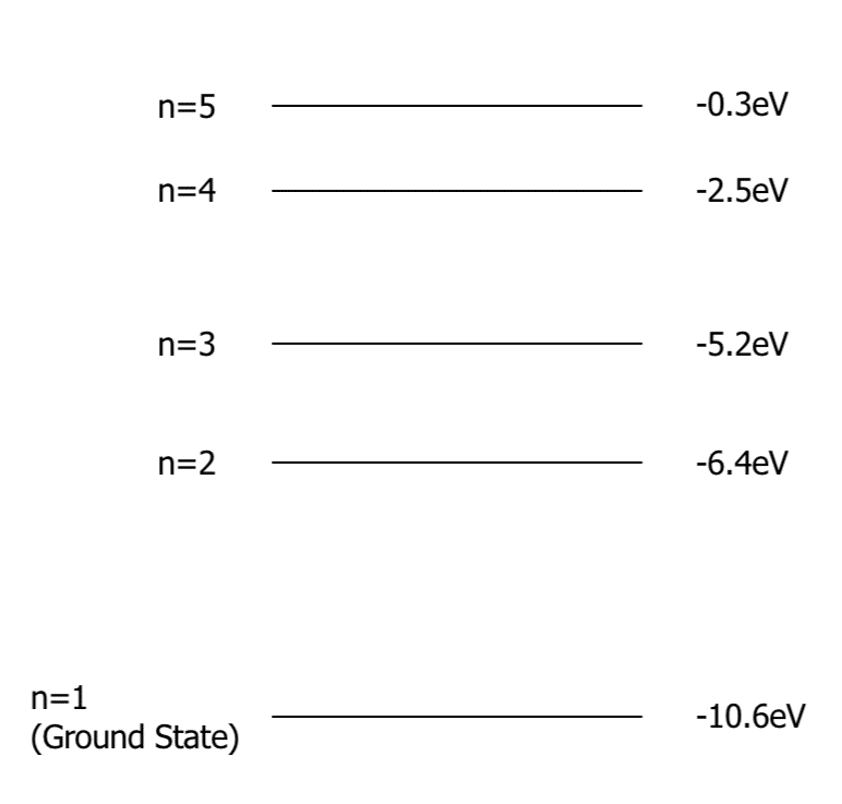

n=1 is known as the ground state. This is the energy level closest to the nucleus of the atom. Beyond n=5 in this diagram is when the electron has overcome the electrostatic attraction of the nucleus and therefore, the atom has been ionised.
As previously mentioned, if an electron gains enough energy to move up energy levels (excitation) it quickly drops back down to its original energy level (de-excitation). In this process a photoelectron is emitted. We can calculate the energy of this resulting photoelectron using the equation:
\textcolor{f21cc2}{hf = E_1 - E_2}
- \textcolor{f21cc2}{h} is Planck’s constant, \textcolor{f21cc2}{6.63 \times 10^{-34}\text{m}^2 \text{kg s}^{-1} }
- \textcolor{f21cc2}{f} is the frequency of the photoelectron in Hertz \left(\text{Hz}\right).
- \textcolor{f21cc2}{hf} is the energy of the photoelectron, often in electronvolts or joules \left(\text{eV or J}\right) \left( E = hf \right)
- \textcolor{f21cc2}{E_1} is the original energy level in electronvolts \left(\text{eV}\right).
- \textcolor{f21cc2}{E_2} is the new energy level in electronvolts \left(\text{eV}\right).
Line Spectra
In the energy level diagrams seen above, you may notice that there are several possible ways that an electron could jump from one energy level to another. In the example we looked at a jump of n=4 to n=1. However, that same electron may have only jumped from n=4, to n =3, n=2 and finally to n=1 in 3 steps. This gives off three photoelectrons of lower energy, and therefore different frequency and wavelength.

The diagram above shows the line spectrum produced by a particular element. The lines represent all the possible wavelengths of light that could be produced by the photoelectrons emitted when this atom de-excites.
Fluorescent Tubing
Fluorescent tubing lights are commonly used to light factories and industrial buildings. They work using the concept of photoelectric emission. See the components of fluorescent tubing in the diagram.
- Glass tubing
- Electrodes (one positive, the other negative)
- Fluorescent coating (usually phosphorous)
- Terminals to connect to a power supply
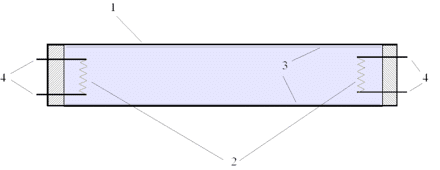
- Inside the tubing is a gas under low pressure (usually mercury).
- Once the tube is connected to a power supply, electrons are emitted from the negative electrode and attracted to the positive electrode by electrostatic attraction.
- In this process, the electrons collide with the atoms of mercury within the tube, causing their electrons to excite.
- This is quickly followed by a rapid de-excitation, giving off a photoelectron of wavelength and frequency of UV light.
- The photons of UV then collide with the phosphorus coating causing the same process to happen, but this time the photoelectrons have the frequency and wavelength of visible light. The photons of visible light have a higher frequency and lower wavelength than the photons of UV.
Example: Calculating the energy of a photoelectron
A photon excites an electron from the ground state to n = 4. Then, consequently, the electron de-excites from n = 4 to n=1.
Calculate the energy of the photoelectron emitted by the de-excitation of the electron.
[2 marks]
\begin{aligned} hf &= E_1 - E_2 \\ hf &= -2.5 \: \text{eV} - -10.6 \: \text{eV} \\ hf &= 8.1 \: \text{eV} \end{aligned}because the energy of the photoelectron is \left( E = hf \right)
Energy Levels and Photon Emission Example Questions
Question 1: State one similarity and one difference between excitation and de-excitation.
[2 marks]
Similarity:
- Both involve the movement of an electron
Difference:
- In excitation, the electron moves up an energy level and in de-excitation the electron moves down an energy level.
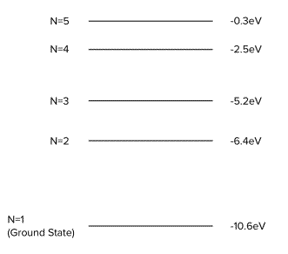
Question 2: Using the diagram below, calculate the frequency of the photoelectron emitted from the de-excitation of an electron from n=5 to n=1.
[3 marks]
Question 3: Using the energy level diagram below, explain which energy level change will result in the largest frequency photoelectron and which would result in the lowest frequency photoelectron.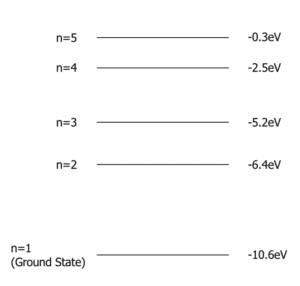
[4 marks]
As we know the equation \boldsymbol{hf = E_1 – E_2} , we can see that the larger the difference in energy levels, the larger the energy of the photoelectron. And as E = hf where h is a constant, \bold{E} is directly proportional to \bold{f}. Therefore, the largest frequency photoelectron would be emitted by the largest energy level change, \boldsymbol{n= 5} to \boldsymbol{n=1} and the lowest frequency photoelectron would be emitted by the change \boldsymbol{n= 3} to \boldsymbol{n= 2}
You May Also Like...

MME Learning Portal
Online exams, practice questions and revision videos for every GCSE level 9-1 topic! No fees, no trial period, just totally free access to the UK’s best GCSE maths revision platform.