
Revise

Distance-Time Graphs
Distance-Time Graphs
Distance-time graphs are a way of visually expressing a journey. With distance on the -axis and time on the -axis, a distance-time graph tells us how far someone/something has travelled and how long it took them/it to do so.
Make sure you are happy with the following topics before continuing:

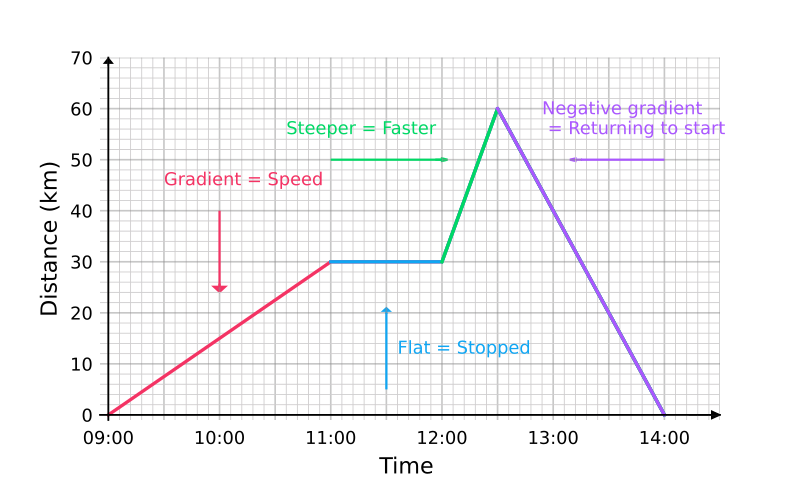
Distance time graphs – Key things to remember:
1) The gradient of the line = speed
2) A flat section means no speed (stopped)
3) The steeper the graph the greater the speed
4) Negative gradient = returning to start point (coming back)
Using Distance Time Graphs
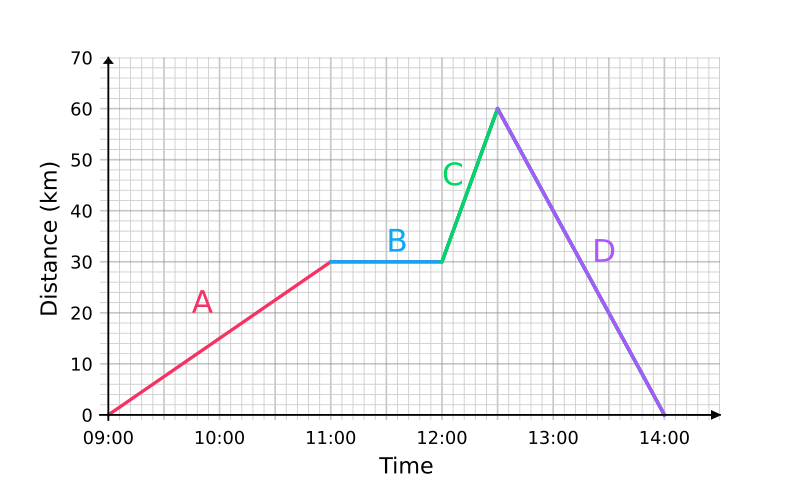
The graph below describes a journey that has several parts to it, each represented by a different straight line.
Part A: , the person travelled km away from their starting point and that took them hours.
Part B: , we can see that the line is flat, so the distance from their starting point did not change – they were stationary.
Part C: , they moved a further km away from their starting point.
Part D: , they travelled the full km back to where they began.
Calculate the speed – for each part of the journey:
Part A:
km/h
Part B:
km/h (Not moving)
Part C:
km/h
Part D:
km/h
From this we can see that the person travelled the fastest over part C.

Example: Bike Ride
Valentina is going for a bike ride. Below is a distance-time graph that describes her full journey.
a) How long was she stationary for?
b) What was the total distance travelled during her journey?
c) What was her average speed in kilometres per hour between and ?
[3 marks]
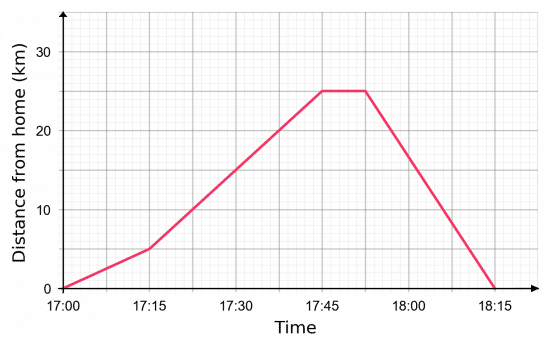
a) We can see that the graph was flat for the duration of one big square. From the axis, we can see that two big squares total minutes, therefore one big square is worth minutes, so she was stationary for minutes.
b) Valentina travelled away km away from home, stopped briefly, and then travelled km back home. Therefore, she travelled km in total.
c) We need to calculate the gradient of the graph between and . This period lasted for minutes, which is equivalent to hours – this is the “change in ”. During this period, she increased her distance from home from km up to km, meaning she travelled km in total – this is the “change in ”. So, we get
km/h
Distance-Time Graphs Example Questions
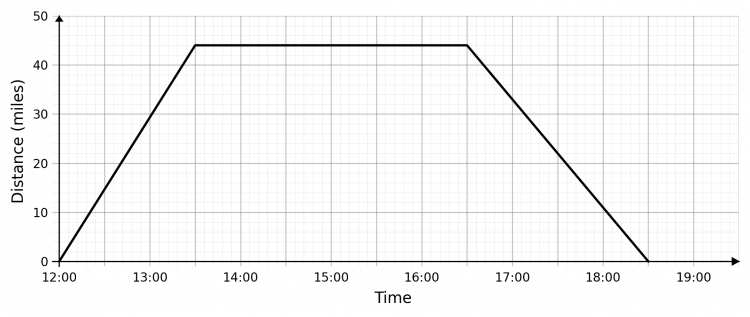
Question 1: From the description of Neil’s journey below, construct a distance-time graph.
Neil left home at and after an hour and a half of moving at a constant speed, he had travelled miles, at which point he stopped. After hours of being stopped, he drove towards home at a constant speed, and it took him hours in total to get home.
[4 marks]
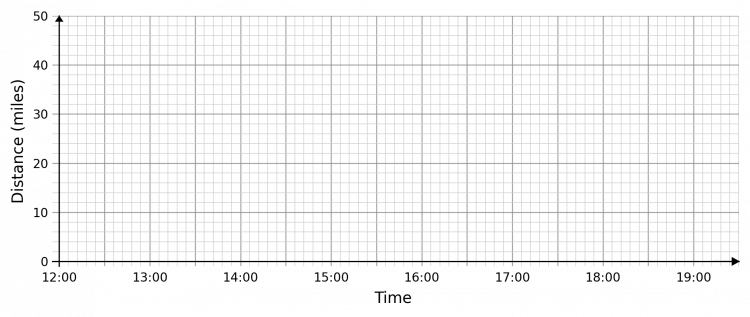
So, making the words above seem more readable, we get:
- , he travels from miles away to miles away;
- , he stays in one place;
- , he travels from miles away to miles away.
On a graph, this looks like:


Question 2: Below is a distance-time graph describing a m race ran by Chris. Work out the maximum speed he reached during this run to 3 significant figures.
[3 marks]
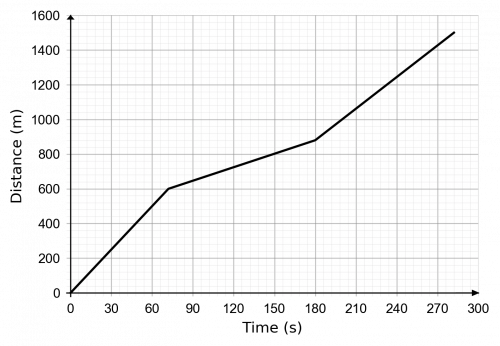
Looking at the graph, we can see that he runs at three different speeds during different portions of the race. The graph becomes less steep in the middle, so that won’t be his period of maximum speed, and the other two are hard to distinguish just by looking so we’ll work them both out.
Period 1:
m/s
Period 3:
m/s
Therefore, the fastest speed travelled by Chris during the race was m/s, to sf.
Question 3: A cyclist on a training ride records the distance she travels away from home. The data only shows the first minutes of the ride before her cycling computer ran out of battery.
[3 marks]
(a) How far did she ride in the first minutes?
(b) For how long was she stationary?
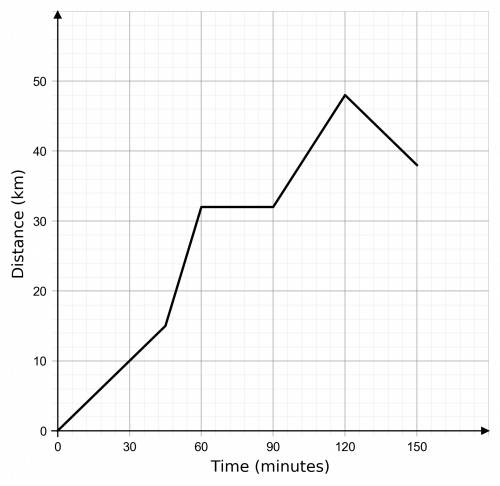
(a) Distance travelled is,
km
(b) She stopped for mins at the km mark.
Question 4: A car journey on a day trip to the coast is recorded.
[2 marks]
Work out the maximum speed over the course of the trip.
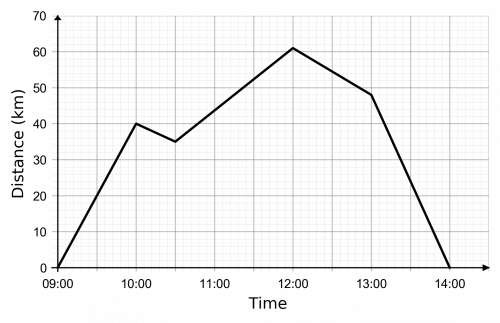
The gradient of a distance time graph is the speed. Hence to find the fastest average speed we must find the steepest section of the graph.
This is the final section which cover km in one hour, thus,
km/h
Specification Points Covered
Algebra – 15. calculate or estimate gradients of graphs and areas under graphs (including quadratic and other non-linear graphs), and interpret results in cases such as distance-time graphs, velocity-time graphs and graphs in financial contexts
Distance-Time Graphs Worksheet and Example Questions

(NEW) Distance Time Graphs Exam Style Questions - MME
Level 4-5GCSENewOfficial MMEDistance-Time Graphs Drill Questions
Distance Time Graphs - Drill Questions
Level 4-5GCSE