
Revise
Collision Theory & Reaction Rates
Collision Theory & Reaction Rates
A reaction can only happen if the particles collide with sufficient energy. How many particles will have at least this minimum energy. will depend on a number of factors, the most important of which is temperature. The distribution of energy within a group of particles can be studied using an expression called the Maxwell-Boltzmann distribution.
Rate of Reaction
The rate of a chemical reaction is the change in the amount of a given reactant or product in a given amount of time. This could be anything from particles formed in an hour, to grams used up per millisecond. Generally however, rates of reaction are measure in \text{mol dm}^{-3}\text{ s}^{-1}.
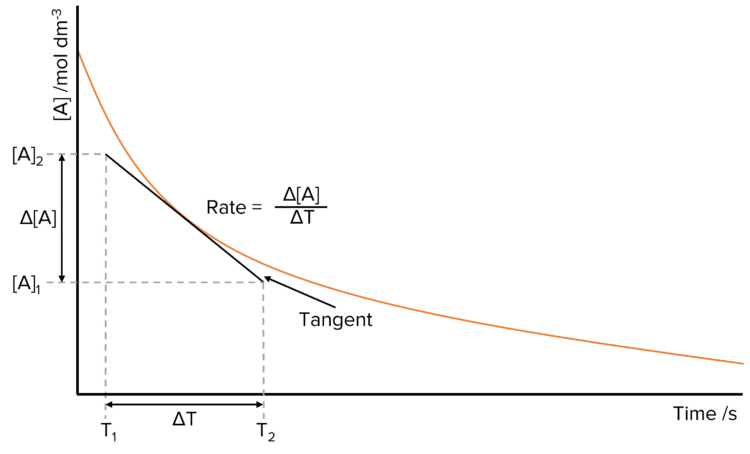
Rates of reaction can be found by measuring the concentration of a product throughout a reaction and then plotting this against time. Most of the time this will produce a curve, where the gradient of the curve at a given point will give the rate of reaction at that point.
To calculate the rate of reaction at a particular time, draw a tangent to curve. Read off the value of time at the start of the tangent, \text{T}_1 and at the end, \text{T}_2, then do the same for concentration. Find the value of \Delta\text{T} (difference in the time \text{T}_1-\text{T}_2) and \Delta[\text{A}] (difference in the the concentration of A, [\text{A}]_1-[\text{A}]_2). Now calculate the rate be dividing the change in concentration of A by the time in which this change took place.
\text{Rate}=\frac{\Delta\text{[A]}}{\Delta\text{T}}

AQA A Level Chemistry Predicted Papers 2026
Our A Level Chemistry Predicted Papers are developed to meet the same standard as real examination papers. All questions are created and reviewed by Chemistry subject specialists, ensuring the style, difficulty and structure align closely with genuine A Level Chemistry assessments. Each pack includes professionally printed exam papers along with physical mark schemes, giving students an authentic exam experience that cannot be replicated by PDFs or generic revision resources. Order below to receive exclusive predicted papers available only from MME.
View Product
Collision Theory
Collision theory is a set of ideas in science that aim to understand how chemical reactions happen. The important things to take from it are here:
- Particles must collide for a chemical reaction to take place.
- For these collisions to be successful they must happen with enough energy.
- The minimum amount of energy needed for two particles to react is known as the activation energy (\text{E}_a) of a reaction.
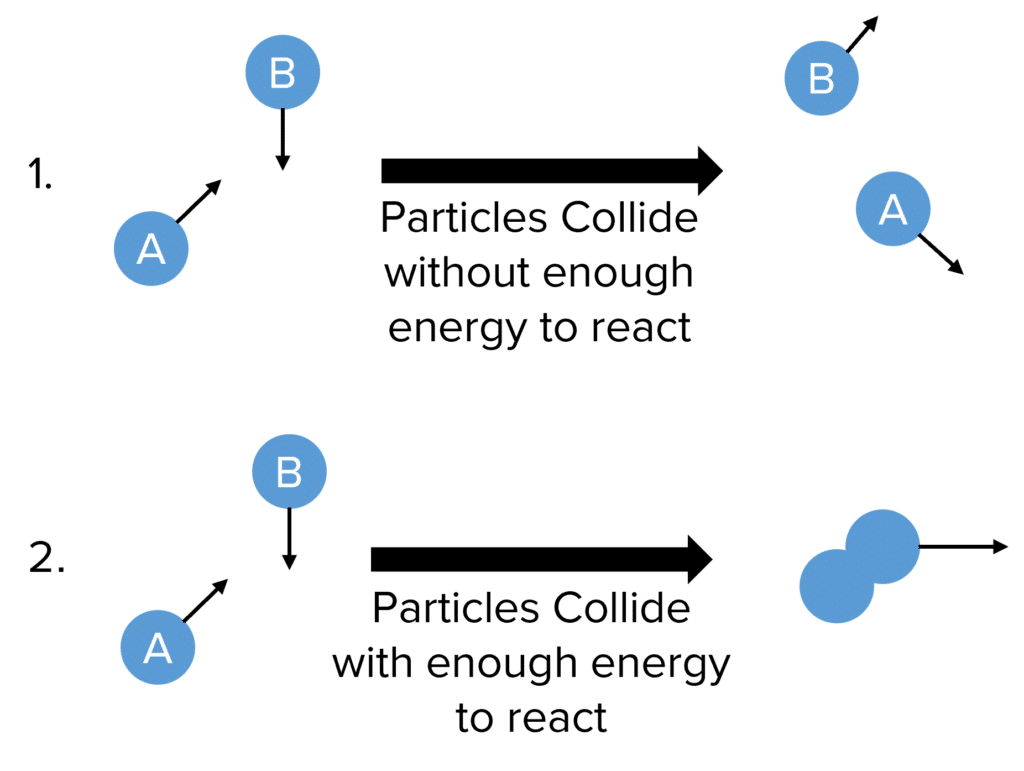
Particles collide all the time, but very few will actually do so with the energy to react. There are therefore two general scenarios:
- Particles collide, but do not have at least the activation energy required to react and simply bounce off on another.
- Particles collide with at least the activation energy and will successfully react.
This means that in a given system, the proportion of particles with at least the activation energy is small. This is demonstrated in the Maxwell-Boltzmann distribution.
Collision theory also allows us to find another definition for the rate of a chemical reaction as:
The number of successful collisions per unit time.
Collision theory can help us to explain changes in the rate of reaction. For example the rate of a chemical reaction often decreases as the reaction progresses. This is because the concentration of the reactants decreases as they are used up. This removes particles from the reaction and so leads to fewer successful collisions between particles.
If we increase the temperature of a reaction, the particles involved gain more kinetic energy. This means they are more likely to collide with at least the activation energy and so lead to more frequent successful collision between particles.
The Maxwell-Boltzmann Distribution
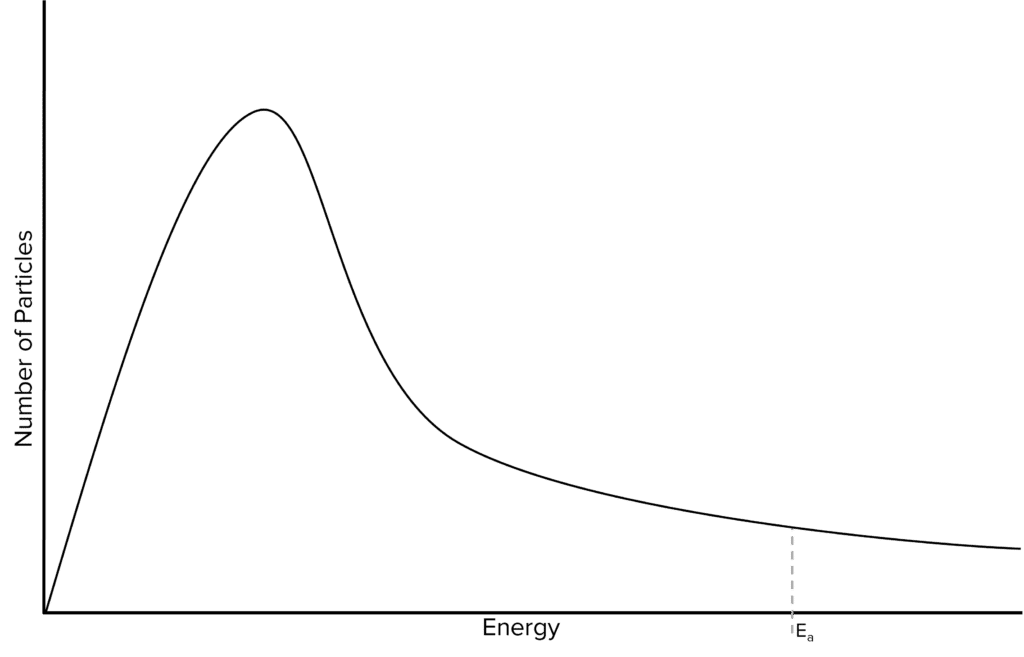
The Maxwell-Boltzmann distribution is a mathematical expression that tells us how fast, or with how much energy, the particles in a given system are moving. When plotted on a graph, the Maxwell-Boltzmann distribution has a fairly distinct shape.
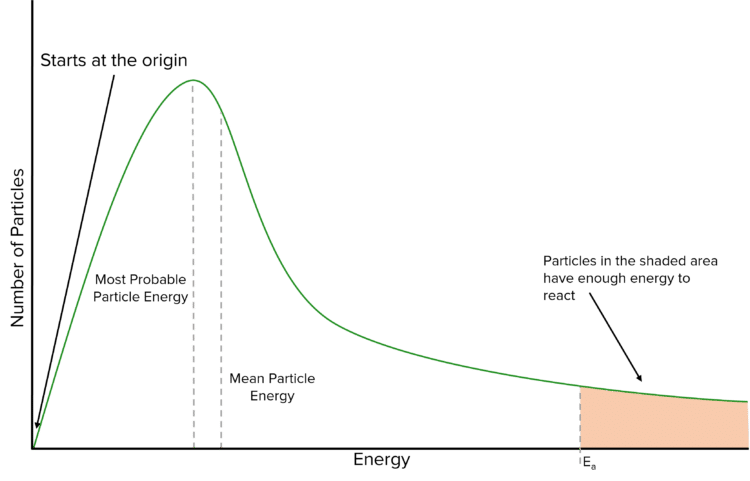
There are a number of important feature in the the Maxwell-Boltzmann curve of a reaction. Firstly, the peak of the of the curve tells us the most probable energy of the particles within the reaction (i.e. the most energy with which most of the particles move). Just to right of this peak is the mean energy of the particles. This is higher than the most probably energy because the graph tails off to the right.
The area underneath the Maxwell-Boltzmann curve is equal to the total number of particles in the reaction. This feature of the curve allows us to work out how many particles will have at least the activation energy of the reaction. These particles are represented on the above graph by the shaded area. It is clear that very few of the particles involved in a reaction will actually have enough energy to react.
Finally, it is important to note that the curve starts at 0. This is because there are 0 particles in the reaction that have 0 energy. At the other end of the curve, it is important to note that whilst the curve will approach 0, it never actually reaches it.
Effect of Changing Temperature
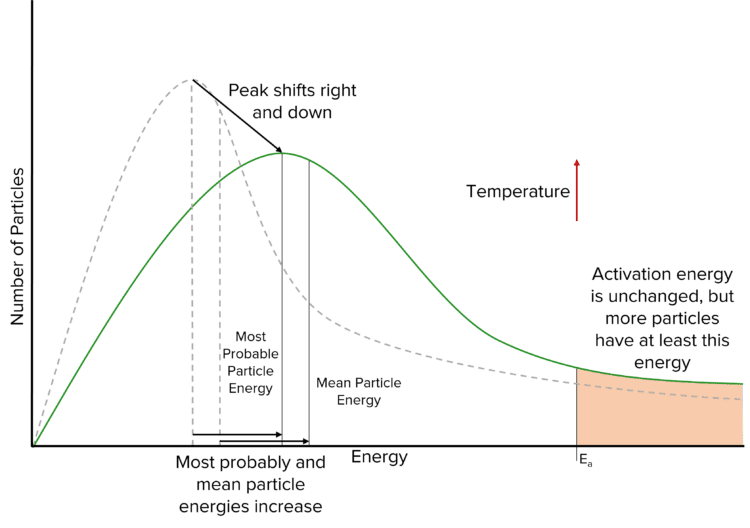
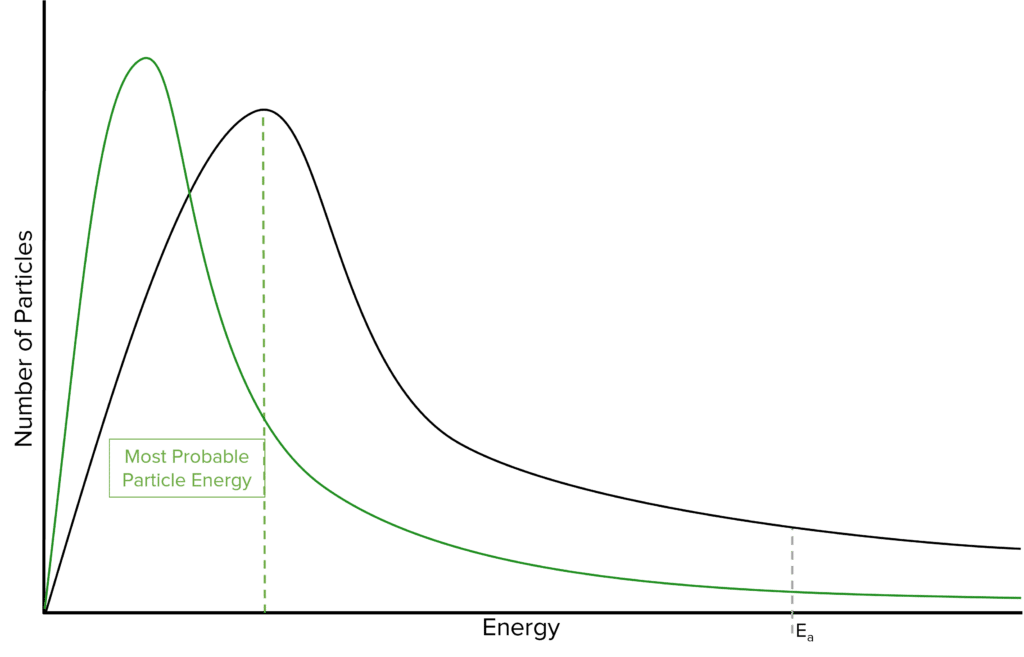
Changing the temperature at which a reaction takes place will change the shape of the Maxwell-Boltzmann distribution as it will change the energy of the particles involved.
Increasing the temperature of a reaction will shift the curve to the right, as more particles will have a higher energy. The area underneath the the curve remains constant as the number of particles is not changing. This leads to a lower peak and a higher tail. The higher tail tell us that, by increasing the temperature of a reaction, we increase the number of particles with at least the activation energy.
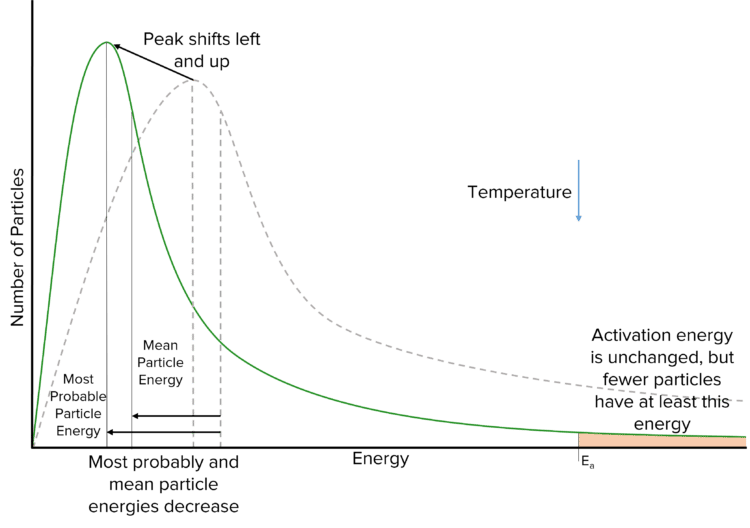
Decreasing the temperature of a reaction will have the opposite effect on the Maxwell-Boltzmann curve. In this case, we are removing energy from the particles and so more particles will have a lower energy. This shifts the peak of the curve to the left and increases its height. The tail of the curve will decrease in height, and so fewer particles will have at least the activation energy.
Effects of Concentration and Pressure
Increasing the concentration or pressure of a reaction would increases the number particles in a given volume making. This will lead to more frequent successful collisions per unit time and hence increase the overall rate of reaction. However, the Maxwell-Boltzmann distribution would not be affected by a change in concentration/ pressure. This is because, despite the increased rate of reaction, the energy of the particles is not increased by these changes. The only factors that will effect the shape of the Maxwell-Boltzmann curve are those that would effect the energy of the particles (i.e. changing temperature).
Effects of Surface Area and Catalysts
Decreasing the particle size of a substance increases the surface area, this leads to more frequent successful collisions per unit time between the reactants which subsequently, increases the rate of reaction.
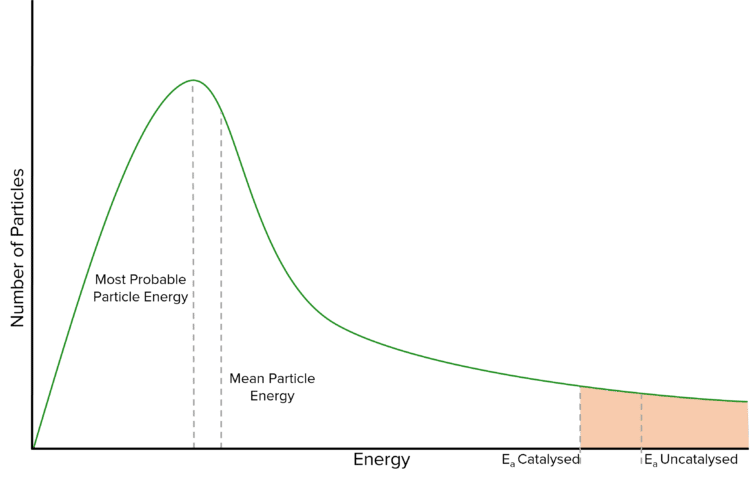
Catalysts increase rates of reaction by providing an alternative route with a lower activation energy than the activation energy of the uncatalysed reaction.
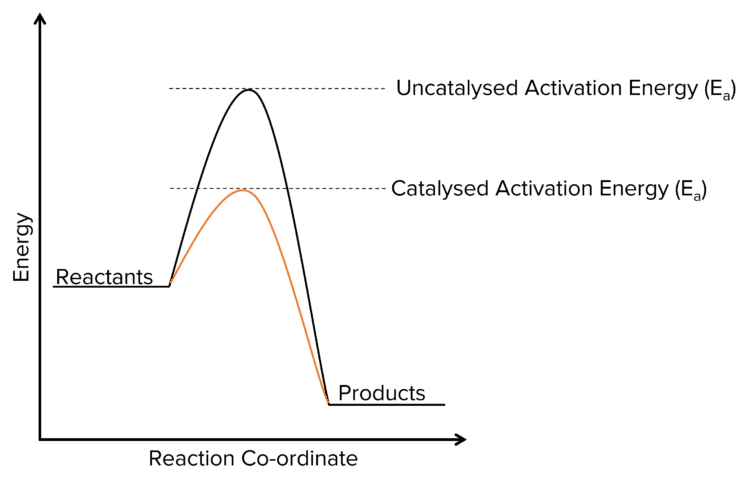
Since catalysts lower activation energy, when the reaction takes place, more molecules are able to meet the activation energy so there are more successful collisions per unit time and the reaction happens faster.
Rate Curves
Rate curves can be used to show the effect of different conditions on the rate of a reaction. By carrying out the same reaction under a range of conditions, and then plotting the concentration against time for all the reactions on the same graph, we can visualize how changing the reaction conditions will affect the rate of said reaction.
The following curves show the affect of changing the concentration of the reactions and of changing the surface area or temperature of the reactants.
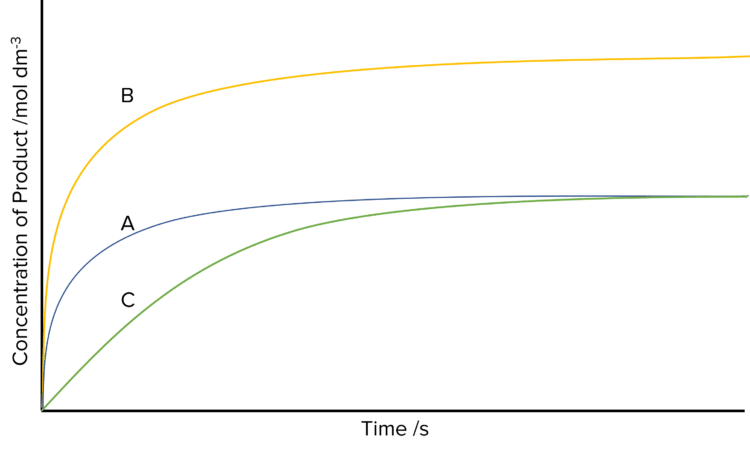
- The original rate of reaction. The rate decreases through out the reaction before plateauing when all the reactants are used up.
- The amount of reactants has doubled. The rate of the reaction has doubled, as has the concentration of product produced.
- The temperature or surface area of the reactants has been decreased. The reaction produces the same amount of product as reaction A, but takes more time to reach the plateau.
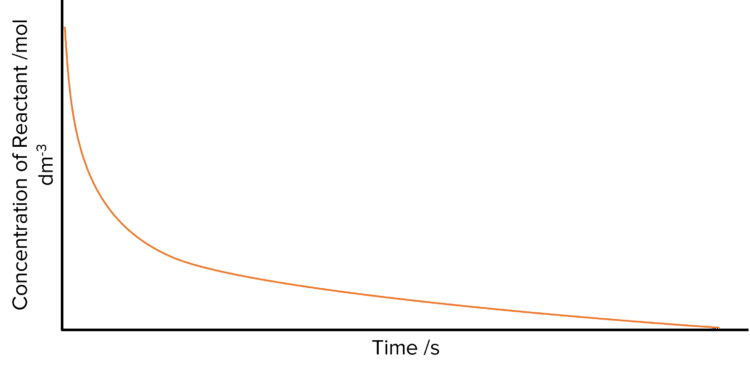
These rate curves all show the rate of reaction in terms of product concentrations. It is equally common to present rates of reaction in terms of reactant concentrations. In these cases the curves will look very similar in shape, but will be flipped upside down.
Collision Theory & Reaction Rates Example Questions
Question 1: Define the term activation energy.
[2 marks]
The minimum energy
Required for a reaction to occur/ to start a reaction/ for successful collisions

Question 2: On this diagram mark the most probable energy (Emp) and sketch a new distribution for the sample at a lower temperature.
[3 marks]
- Marking Emp
- New graph has its peak to the left and higher than the original
- Curve starts at origin, new curve crosses original once, new curve towards energy axis(not touching) and below original curve.
Question 3: Hydrochloric acid reacts with pure magnesium in an exothermic reaction. The rate of reaction is measured and the following curve is obtained.
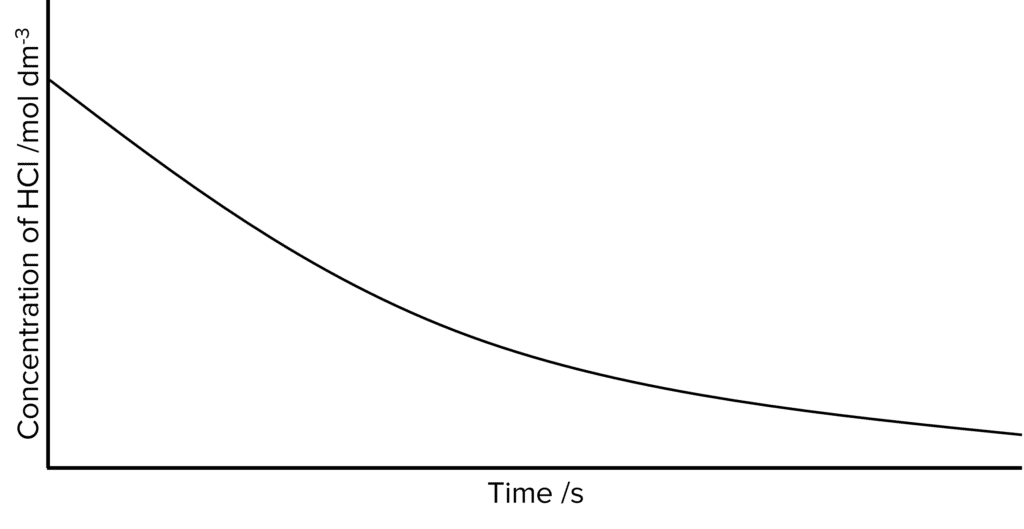
Using collision theory, explain why the line is not straight.
[3 marks]
- As the reaction proceeds the concentration of \text{HCl} decreases.
- This reduces the number of particles in the reaction.
- Therefore there are fewer successful collisions (between particles).
Specification Points Covered
AQA A Level-
3.1.5.1 Collision theory
3.1.5.2 Maxwell–Boltzmann distribution
3.1.5.3 Effect of temperature on reaction rate
3.1.5.4 Effect of concentration and pressure
3.1.5.4 Effect of concentration and pressure