Stratified Sampling
Stratified Sampling Revision
Stratified Sampling
Stratified sampling is a method we can use to make our sample more representative. Make sure you are happy with the following topics before continuing.
Stratified Sampling
By separating the population into groups (age groups, genders, etc.) called strata, we can ensure that the number of people who will be sampled from each group is proportional to the number of people in that group overall.
We choose to use a stratified sample when there are significantly different numbers of people/things in each group.
You can calculate the number of people needed from each group using the following formula:
\text{number to be sampled from group} = \dfrac{\text{\textcolor{blue}{number of people in group}}}{\text{\textcolor{limegreen}{size of population}}} \times \text{sample size}
Example 1
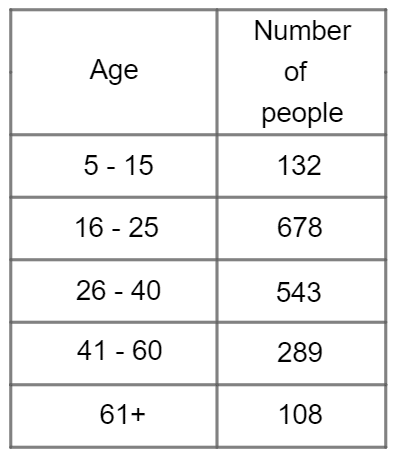
The breakdown of ages of all visitors to a convention is given in the table below.
Fabine wants to take a stratified sample of the visitors at the convention.
She chooses a sample size of 80.
Calculate how many people she will need to sample from each age group.
[4 marks]
Step 1: First, we need to establish how many people were at the convention. Adding up the numbers, we get
\text{total population }=132+678+543+289+108=1,750
Step 2: We must apply the formula shown above. The number she should sample from the 5 – 15 group is
\dfrac{\textcolor{blue}{132}}{\textcolor{limegreen}{1,750}}\times 80=6.034...
Then, for the 16 – 25 group: \dfrac{\textcolor{blue}{678}}{\textcolor{limegreen}{1,750}}\times 80=30.994...
The 26 – 40 group: \dfrac{\textcolor{blue}{543}}{\textcolor{limegreen}{1,750}}\times 80 = 24.822...
The 41 – 60 group: \dfrac{\textcolor{blue}{289}}{\textcolor{limegreen}{1,750}}\times 80=13.211...
Lastly, the 61+ group: \dfrac{\textcolor{blue}{108}}{\textcolor{limegreen}{1,750}}\times 80=4.937...
Obviously, we can’t select decimal numbers of people, so we have to round all these values to the nearest whole number. Doing so, we get that the number of people to be sampled from each group (in order) is
6,\,\,31,\,\,25,\,\,13,\,\, and \,\,5
Example 2
Odette has taken a stratified sample of people who work at her company based on gender. There are 500 people at her company. The table below gives some information about sizes of the groups. Complete the table.
[3 marks]
We know there are 500 people in the company, but not how many are in the sample. So, instead of using the formula, we’re going to consider the fact stated just above:
“the ratio of the groups in the sample must equal the ratio of the groups in the population”

Step 1: Calculate the Scale factor
The values in the sample must all be scaled down by the same scale factor from the original values.
Given that there are 255 females at the company and 51 in the sample, we get
\text{scale factor } = 255\div 51=5
Step 2: Calculate using the scale factor.
We multiply the scale factor by the number of males in the sample
\text{Number at company: male category } = 47\times 5 = 235\text{ people}
Similarly, considering that the sample is 5 times smaller than the population we get
\text{Number in sample: other category }=10 \div 5= 2\text{ people}
The completed table can be seen below.

Stratified Sampling Example Questions
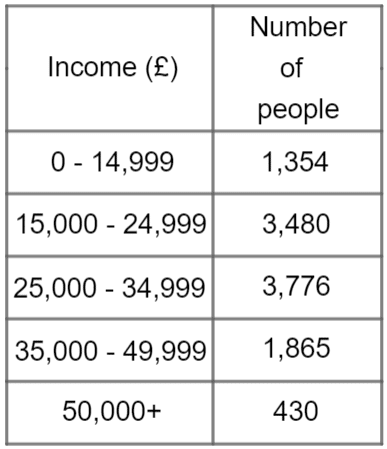
Question 1: Ana wants to conduct a survey on the eating habits of people in her village. She is planning on taking a stratified sample of 200 people based on their annual income.
The table below outlines the population of her village separated by their incomes:
Calculate the number of people she should sample from each income range.
[4 marks]
First of all, we need to calculate the total population.
\text{Total population }=1,354+3,480+3,776+1,865+430=10,905
We can use the formula to see how big our sample from each group should be (if you don’t like having to remember formulae, then use some maths logic by simply working out what percentage of the total population a particular income group represents, and then calculate this percentage of your sample size of 200):
\text{number to be sampled from group }=\dfrac{\text{number of people in group}}{\text{size of population}}\times \text{sample size}
\text{0 - 14,999 group: }\dfrac{1,354}{10,905}\times 200=24.832...=25 \text{ people}
\text{15,000 - 24,999 group: }\dfrac{3,480}{10,905}\times 200=63.823...=64 \text{ people}
\text{25,000 - 34,999 group: }\dfrac{3,776}{10,905}\times 200=69.252...=69 \text{ people}
\text{35,000 - 49,999 group: }\dfrac{1,865}{10,905}\times 200=34.204...=34 \text{ people}
\text{50,000 group: }\dfrac{430}{10,905}\times 200=7.886...=8 \text{ people}
If you want to check that your calculations are correct, then add up the totals for each group and the total should be the desired total of 200.
25+64+69+34+8=200
Question 2: A house leader is doing a student voice survey about the sports facilities at her school. The below table shows information about the number of students in each year group:
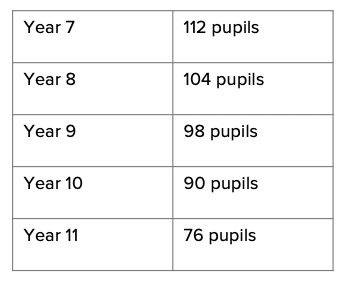
The house leader would like a stratified sample of 80 students.
How many students does she need to survey from each year group?
[4 marks]
First of all, we need to calculate how many students there are in total:
112+104+98+90+76 = 480\text{ students}
If the house leader would like a stratified sample of 80 students, then we can work this out as a fraction (or even percentage) of the whole student population:
\dfrac{80}{480} = \dfrac{1}{6} \text{ or } 16.6\%
(Seeing the sample as \frac{1}{6} will be easier to manage than a difficult % amount.)
Since the house leader would like a stratified sample of \frac{1}{6} of the whole school population, this means that she will need to survey \frac{1}{6} of each year group. For each year group, the number of students to be surveyed per year group can be calculated as follows:
Year 7: \dfrac{112}{6}=19\text{ students}
Year 8: \dfrac{104}{6}=17\text{ students}
Year 9: \dfrac{98}{6}=16\text{ students}
Year 10: \dfrac{90}{6}=15\text{ students}
Year 11: \dfrac{76}{6}=13\text{ students}
We have been given complete information for the football club, and we can see that there are 196 players in total, of which 28 have been selected for the sample. In other words, 28 out of 196 are in the sample. We can write this as a fraction:
\dfrac{28}{196}
This fraction can be simplified to:
\dfrac{1}{7}
(If this is not an easy fraction for you to simplify, remember that the line of a fraction means ‘divide’, so if you type into your calculator 28\div196 your calculator should give you the answer \frac{1}{7}.)
Therefore \frac{1}{7} of the football club is included in the sample.
Since Michael is conducting a stratified sample, this means that he is taking a sample of \frac{1}{7} from each category.
Since the rugby club has a total of 91 members, the number included in the sample can be calculated as follows:
\dfrac{91}{7} = 13\text{ players}
For the basketball team, we have been given the sample size and not the total number of members in the club. Since the sample size is \frac{1}{7} of the total, this means that 19 basketball players = \frac{1}{7} of the overall total. Therefore the total number of basketball players is:
19\times7=133\text{ players}
Therefore, the completed table should look like this:
Question 4: Alisha wants to survey 30\% of her sixth form to find out how many of them are going to higher education. She surveys 81 students in total. If there are 156 students in year 12, how many students are there in year 13?
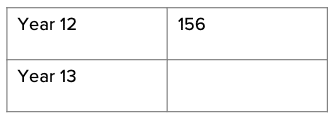
[4 marks]
If we know that 81 students represent 30\% of the entire sixth form, then we can work out how many students there are in total in the sixth form.
If
30\% = 81\text{ students}
then
10\% = 81\div3 = 27\text{ students}
so
100\% = 27\times10=270\text{ students}
Therefore, if there are 270 students in the sixth form, of which 156 are in year 12, then we can easily work out the number of students in year 13:
270-156=114\text{ students}
Question 5: The head of maths wants to take a survey to obtain information about the quality of the teaching that the students in the school are receiving.
He would like to take a sample of 80 students, stratified by age and by gender.
The table shows the number of students, and their gender, per year group.
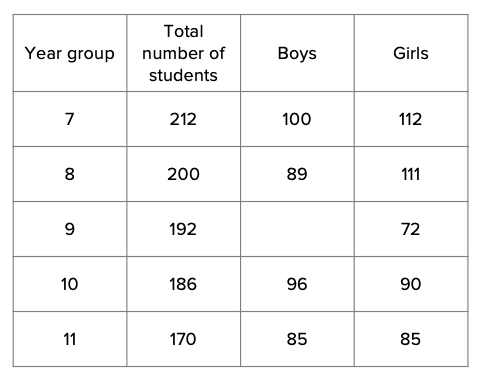
How many boys does the head of maths need to survey from year 9?
[4 marks]
First of all, we need to calculate the entire student population. In total there are:
212+200+192+186+170=960\text{ students}
The head of maths would like a sample of 80 students, so we can work out what fraction of the entire student population this represents, and simplify the fraction:
\dfrac{80}{960} = \dfrac{1}{12}
Therefore, for his stratified sample, he will need to survey \frac{1}{12} of each year group.
We know that there is a total of 192 students in year 9, so the total number of students he needs to survey in year 9 can be calculated as follows:
\dfrac{192}{12} = 16\text{ students}
However, the head of maths can’t simply survey 8 boys and 8 girls because he is also stratifying by gender as well as age.
We know that there are 192 students in total in year 9, of which 72 are girls, so we need to work out how many boys there are:
192-72=120\text{ boys}
We now need to work out what fraction of the year group are boys. Since 120 out of the 192 students are boys, we can write this as a fraction, and simplify:
\dfrac{120}{192} = \dfrac{5}{8}
If \frac{5}{8} of the year group are boys, this means that \frac{5}{8} of the 16 year 9 students he plans to survey have to be boys.
\dfrac{5}{8}\times16 = 10\text{ boys}
Therefore, the head of maths needs to survey 10 year 9 boys.
Stratified Sampling Worksheet and Example Questions
(NEW) Stratified Sampling Revision Exam Style Questions
Level 4-5GCSENewOfficial MME
MME Premium Membership
£19.99
/monthLearn an entire GCSE course for maths, English and science on the most comprehensive online learning platform. With revision explainer videos & notes, practice questions, topic tests and full mock exams for each topic on every course, it’s easy to Learn and Revise with the MME Learning Portal.
Sign Up Now
