Stem and Leaf Diagrams
Stem and Leaf Diagrams Revision
Stem and Leaf Diagrams
A stem and leaf diagram is a way of displaying a collection of numbers. The ‘stem’ consists of the first part of every number, usually the first digit(s) and the ‘leaf’ consists of the latter part of every number, usually the last digit. We need to know how to draw them and how to use them.
Make sure you are happy with the following topics before continuing.
Drawing a Stem and Leaf Diagram
We need to be able to draw stem and leaf diagrams, along with a key that tells us what the numbers in the diagram mean.
Example: Scott measured the height of all the people in his choir. The values, in cm, are given below.
154,\,\,180,\,\,176,\,\,153, \, 162,\,\,165,\,\,154,\,\,186,
190,\,\,187,\,\,176,\,\,176, \, 172,\,\,182,\,\,177,\,\,169
Draw a stem-and-leaf diagram to represent Scott’s data.
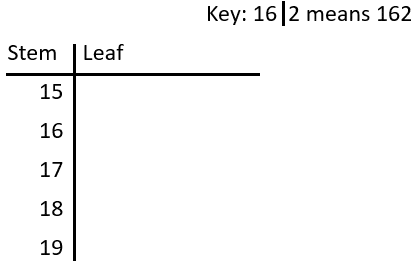

Step 1: Figure out what our key will be. The stem will be the first two digits, whilst the leaf will be the last digit. Our key is any number that is in the list, represented in terms of a stem and leaf.
Step 2: Use our key to draw our stem part of the diagram, which will have to include: 15, \, 16, \, 17, \, 18, \, 19 as shown.
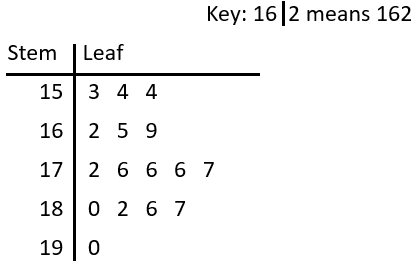

Step 3: Rewrite the data in numerical order.
153,\,\,154,\,\,154,\,\,162, \,165,\,\,169,\,\,172,\,\,176,
176,\,\,176,\,\,177,\,\,180, \,182,\,\,186,\,\,187,\,\,190
Step 4: Fill in the ‘leaf’ values (the last digit of every value) alongside the correct ‘stem’ value, to complete the stem and leaf diagram.
Using a Stem and Leaf Diagram
We also need to be able to interpret stem and leaf diagrams to be able to solve questions on the mean, median, mode and range of numbers.
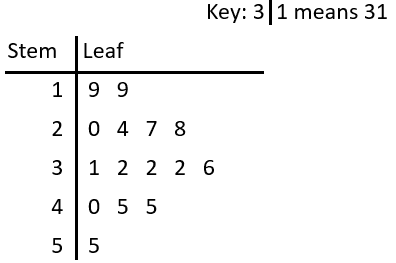

Example: Ramona collected the ages of colleagues and recorded her results using a stem and leaf diagram.
Find the mode, median and range of her colleagues ages.
Mode means the number that appears most often. Here we can see that the number 2 appears three times in the ‘3’ row – more times than any other value appears, therefore the mode is 32.
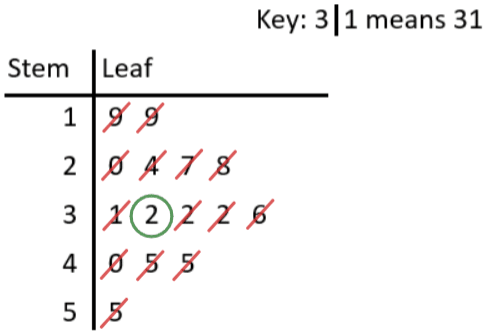

Median is the middle value. A common method for finding the median is to cross out the smallest value, then the largest, then the 2nd smallest, then the 2nd largest, and so on until you only have 1 value left. This is shown in the diagram below. Therefore the median is 32.
Range is the largest value minus the smallest. Reading off the diagram, we see the smallest value is 19, whilst the largest is 55. So, we get
\text{range }=55-19=36
Stem and Leaf Diagrams Example Questions
Question 1: After several months of growth, Kim measures the height in centimetres of each of her plants. Their heights are given below:
38,\,\,14,\,\,22,\,\,36,\,\,35,\,\,29, \,19,\,\,24,\,\,32,\,\,35,\,\,41,\,\,47
Draw a stem and leaf diagram for Kim’s data.
[4 marks]
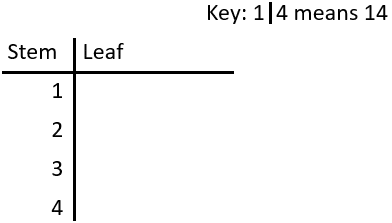
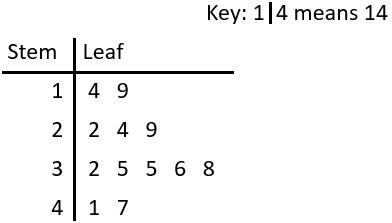
All of these values are 2-digit numbers, so the first digits will be in the ‘stem’ section, and the second digits will be in the ‘leaf’ section. Since the lowest number begins with a ‘1‘ and the highest begins with a ‘4‘, our stem and leaf diagram, including the key, should look like the one below:
(Any value can be chosen as an example for the key.)
To ensure that you don’t inadvertently omit any of the values, it would be a good idea to write them out in order (check that your list contains the same number of values as in the question, so in this example, check that you have 12 values):
14,\,\,19,\,\,22,\,\,24,\,\,29,\,\,32, \,35,\,\,35,\,\,36,\,\,38,\,\,41,\,\,47
To complete the stem and leaf diagram itself, first of all look at all the values that start with 1 (14 and 19), and enter their last digits in the leaf section of the 1 stem (so you would write ‘4‘ and ‘9‘ in the leaf section). Then repeat this process values beginning with 2, then with values beginning with 3 etc.
Your completed stem and leaf diagram should look like the below:
Question 2: Wallace records how long it takes him to get to work in the morning every day for three weeks. His results have been displayed in the stem and leaf diagram below: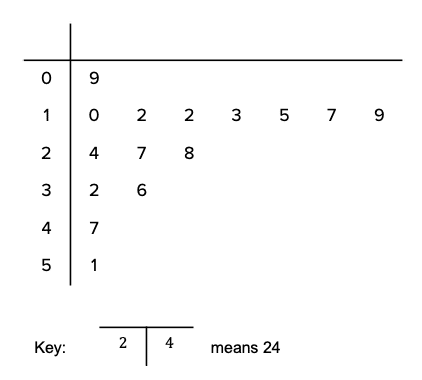
a) Write down the mode.
b) Calculate the range.
c) What percentage of Wallace’s journeys are under 20 minutes? Give your answer to 1 decimal place.
[4 marks]
a) The only number to appear more than once is the ‘2’ leaf on the ‘1’ part of the stem. Therefore, the mode is 12.
b) The largest value is 51 (stem of ‘5’ and leaf of ‘1’ ) and the smallest is 9 (stem of ‘0‘ and leaf of ‘9’). So, the range is
51-9=42
c) All the journeys under 20 minutes are the ones that appear in the ‘0’ stem or the ‘1’ stem. From the diagram, we can see that there are 8 journeys in these two sections, and in total there are 15 times recorded. This means that 8 out of 15 journeys were under 20 minutes, which can be written as the following fraction:
\dfrac{8}{15}
To convert a fraction to a percentage, we need to divide the top of the fraction by the bottom and multiply by 100:
\dfrac{8}{15}\times100 = 53.3\%
Question 3: A farmer weighs all the calves that his cows have produced. Their weights in pounds are shown in the stem and leaf diagram below: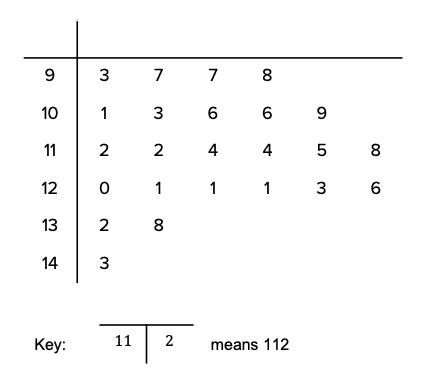
a) What is the range of the calves’ weights?
b) What is the modal calf weight?
c) To the nearest pound, what is the mean calf weight?
d) The farmer forgot to include the weight of his favourite calf, Derek, who has a weight of 156 pounds. If the farmer includes Derek in his data, how will it affect the mean weight?
[5 marks]
a) The range is the difference between the weight of the heaviest calf and the weight of the lightest calf. The heaviest calf will be in the ‘14’ stem. There is only one calf in this stem and its leaf is 3, so the weight of the heaviest calf is 143 pounds. The lightest calf will be the calf with the lowest value in the ‘9’ stem, so the weight of the lightest calf is 93 pounds. Therefore the range of the calves’ weights is
143-93=50\text{ pounds}
b) The modal weight is the most frequently occurring weight. In the ‘12’ stem, we can see that there are 3 values of 1, more than any other in the stem and leaf diagram. A value of 1 in the ‘12’ stem represents a weight of 121 pounds.
c) The mean weight of the calves is the total weight divided by the total number of calves. By counting the number of digits in the leaf section, we can see that there are 24 calves in total. The sum of their weights can be calculated as follows:
93+97+97+98+101+103+106+106+109+112+112+114+114+115+118+120+121+121+121+123+126+132+138+143=2740\text{ pounds}
(Since there are a lot of numbers to add up, I would perform the above calculation twice to ensure you arrive at the same answer. It might even be safer to work out the subtotals for each stem section and then add up these subtotals.)
The mean weight of the calves can be calculated as follows:
\dfrac{2740\text{ pounds}}{24\text{ calves}} = 114\text{ pounds}
d) The mean weight of the 24 calves is 114 pounds. Introducing another calf to the data set that is greater than 114 pounds will increase the mean weight of the calves.
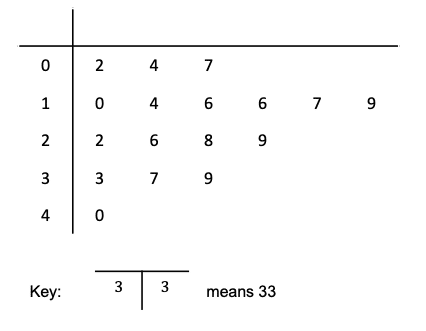
Question 4: Jamal is the star player in the school’s basketball team.
The points he scores in matches are shown in the stem and leaf diagram below:
a) What is the median number of points scored in a match?
b) In what fraction of the games does Jamal score ten points or less?
c) To the nearest whole number, in what percentage of the matches does Jamal score between 20 and 35 points?
d) When Jamal scores over 25 points, the team win. When he scores less than 25 points, they lose. If Jamal were to score the same number of points in the following 17 games, what would be the probability of his team winning the next match? Give your answer as a decimal to one decimal place.
[6 marks]
a) The median is the middle value. By counting up the number of values in the leaf section, we can see that there is a total of 17 values. To work out which value gives us the median, we need to remember the following formula:
\dfrac{n+1}{2} (where n represents the total number of values)
Since there are 17 values in total, n = 17, so:
\dfrac{17+1}{2} = 9
The median comes from the 9th value (do not make the mistake of thinking that the median is 9 points). Count the values in the leaf sections row by row until you reach the 9th value (so in the ‘0’ stem, 2 is value 1, 4 is value 2, 7 is value 3 and in the ‘1’ stem, 0 is value 4 etc.). If you have counted correctly, then the 9th has a stem of ‘1’ and a leaf of ‘9‘, meaning that the median number of points scored is 19.
b) Jamal has played in 17 matches in total. In these matches, he has scored 10 points or less on 4 occasions (don’t forget to include the value 10). Therefore he has scored 10 points or less in 4 out of the 17 matches, which can be expressed as the following fraction:
\dfrac{4}{17}
c) In the 17 matches that Jamal plays, he scores between 20 and 35 points on 5 occasions. This can be expressed as the following fraction:
\dfrac{5}{17}
The question wants us to give the answer as a percentage rather than as a fraction. To convert a fraction to a percentage, divide the top by the bottom and multiply by 100:
\dfrac{5}{17}\times 100 = 29\%
d) First of all, we need to work the number of matches in which Jamal has scored over 25 points. Jamal has scored more than 25 points on 7 out of 17 occasions. Since the team always wins when Jamal scores over 25 points (and loses when he doesn’t), then the team wins 7 times out of 17. Therefore the probability of winning the next game can be expressed as the following fraction:
\dfrac{7}{17}
This fraction is the probability of the team winning the next game, but we are asked to give the answer as a decimal. To convert a fraction to a decimal, simply divide the top by the bottom:
7\div17=0.4
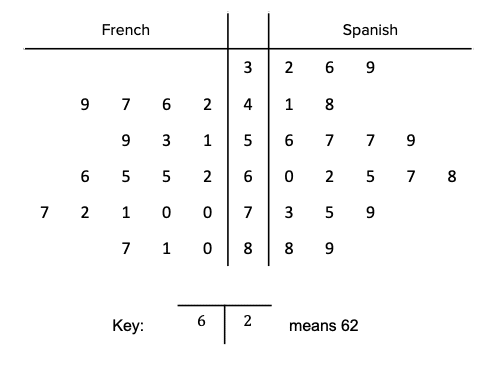
Question 5: The head of modern languages is looking at the year 11 mock exam results for French and Spanish.
The results are shown below in the stem and leaf diagram:
a) What is the modal score for Spanish?
b) What is the modal group for French?
c) What is the difference between the range for French and the range for Spanish?
d) By what percentage is the median for French greater / less than the median score for Spanish? State whether the percentage amount is greater or less than the median Spanish score.
[6 marks]
a) The modal score for Spanish is the most frequently occurring score for Spanish. In the stem of 5, there are 2 values of 7, more than other since there are no other duplicate scores for Spanish, so the modal score is 57.
b) The modal group for French is the group (not score) which has the highest number of values in it. Make sure to look at the values on the left of the stem column, and not the Spanish values which are to the right. In the French side of the stem and leaf diagram, there are 5 values listed in the 7 stem group. The modal group is therefore the 70s or the 70 – 79 group, since values that belong to this group must begin with a 7.
c) The range is the difference between the highest and the lowest value.
The highest score for French is 87 (stem of 8, leaf of 7) and the lowest is 42 (stem of 4, leaf of 2). Therefore the range for French is 87-42=45.
The highest value for Spanish is 89 (stem of 8, leaf of 9) and the lowest is 32 (stem of 3, leaf of 2). Therefore the range for Spanish is 89-32=57.
The question asks for the difference between the range for French and the range for Spanish which can be calculated as follows:
57-45=12
d) The median is the middle score. In order to work out which value will give us our median, we need to know how many values there are. There are 19 values for French and 19 values for Spanish. To work out the median, we need to remember the following short formula where n represents the total number of values:
\text{median}=\dfrac{n+1}{2}
In this question the value of n is 19, so the median value can be calculated as follows:
\dfrac{19+1}{2}=10
The median is not simply the number 10; it is what the 10th value represents (which will probably be different for French and Spanish).
For Spanish the first value is 32 (stem 3, leaf 2), the second 36 (stem 3, leaf 6), third 39 (stem 3, leaf 9), fourth 41 (stem 4, leaf 1) etc. Continuing, we will find the tenth value for Spanish which has a value of 60.
Finding the 10th value for French is a little bit harder due to the fact that this is a back-to-back stem and leaf diagram, so the values on the left of the stem (the French values) are in ascending order from right to left. The first value is 42 (stem 4, leaf 2), the second 46 (stem 4, leaf 6), third 47 (stem 4, leaf 7), fourth 49 (stem 4, leaf 9), fifth 51 (stem 5, leaf 1) etc. Continuing, we will find the tenth value for French which is 65.
The question asks by what percentage the French median score is greater or less than the Spanish median score, meaning we need to work out the difference between the median scores as a percentage of the median Spanish score.
The difference between the two median scores is 5, so we need to work out 5 as a percentage of the median Spanish score which is 60:
\dfrac{5}{60}\times100=8\%
Since the median French score is greater and not less than the Spanish score, the median French score is 8\% greater than the median Spanish score.


