Revise
Reading Off Graphs
Reading off Graphs
Being able to read off graphs is an important skill. Luckily, it is relatively simple and if you know the method it can be an easy way to collect marks in an exam.
How to Read off Graphs
Reading off graphs is a fundamental skill – it allows us to convert between values without having to perform complicated calculations. Providing the graph features a line (as opposed to individual points, such as in a scatter graph), we can perform conversions using the following three steps:
- Identify the variable on one axis
- Draw a straight line from the axis towards the graph
- When the straight line crosses the graph, draw another line to the other axis and identify the value of the other variable
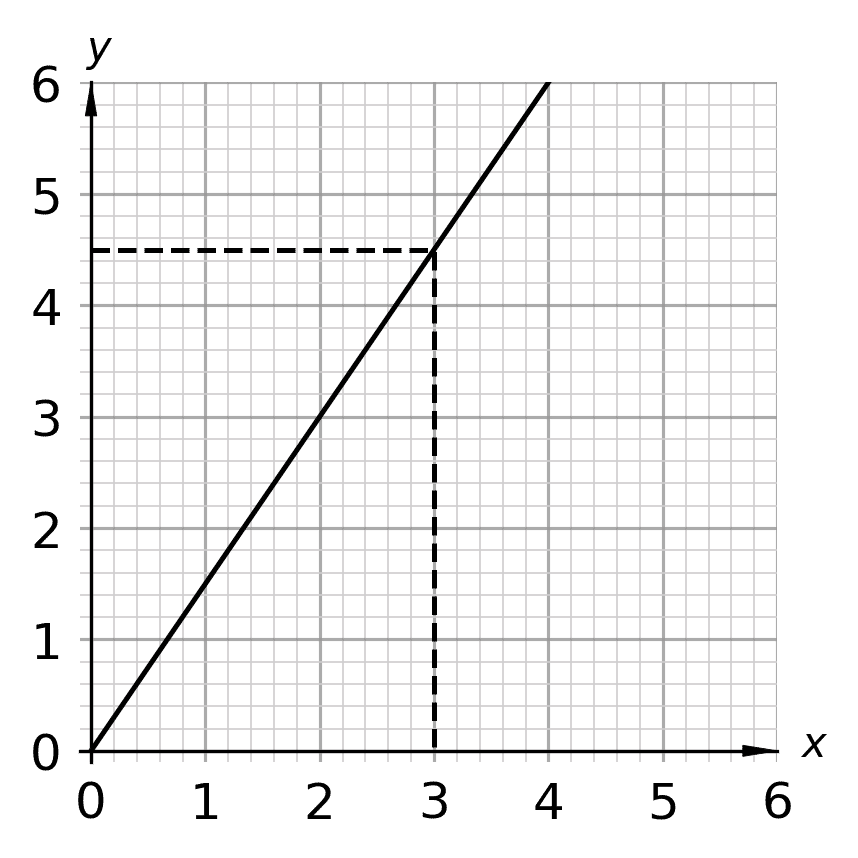
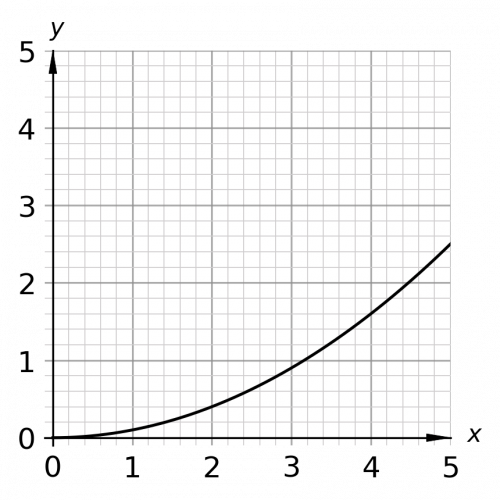
Example: Use the graph on the right to find the value of y when x=3
Following the steps above, we need to first go to the position of 3 on the x-axis (horizontal axis).
Next, we need to draw a straight line upwards to the graph.
When we hit the line of the graph, draw a horizontal line across to the y-axis (vertical axis).
As can be seen, the value on the y-axis is 4.5, so when x=3, y=4.5

Example: Conversion Graphs

The conversion graph on the right can be used to convert distances between miles and kilometres. Use the conversion graph to convert the following:
a) 5 miles into kilometres
b) 10 kilometres into miles
[2 marks]
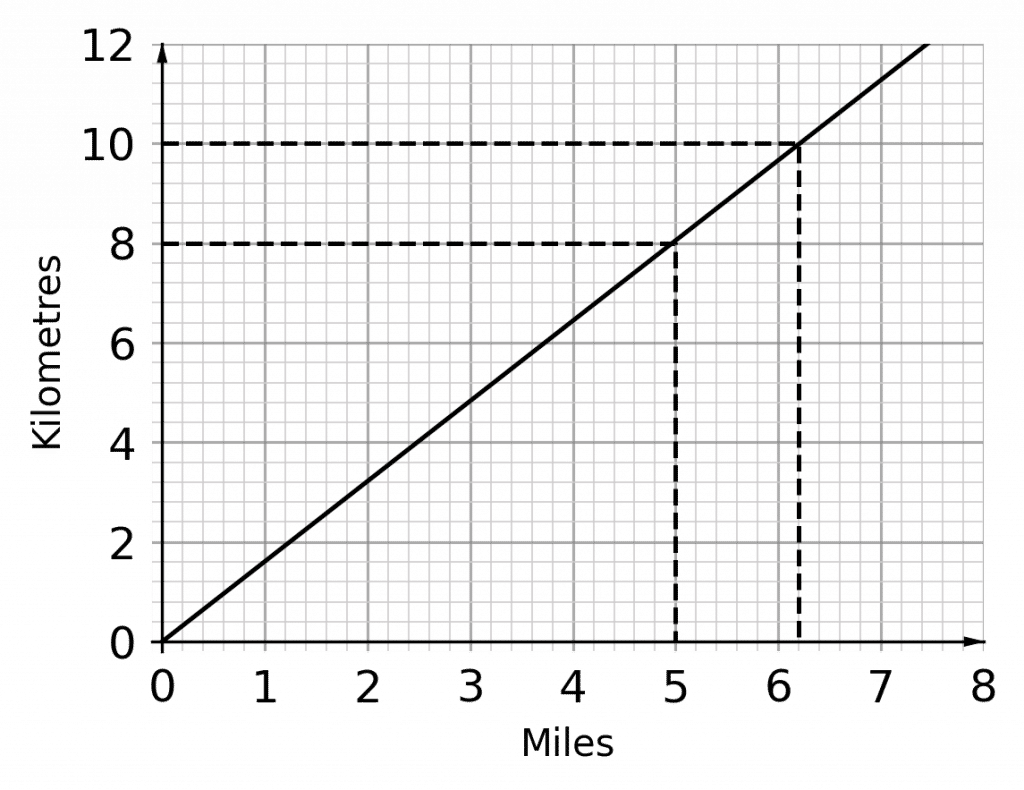
a) Identify the position of 5 miles on the horizontal axis. Next, draw a straight line upwards to the line of the graph, then draw a horizontal line from the graph to the vertical axis. As shown in the image on the right, 5 miles is equivalent to 8 kilometres.
b) Identify the position of 10 kilometres on the vertical axis. Draw a straight line across to the line of the graph, then draw a vertical line downwards to the horizontal axis. As shown in the image on the right, 10 km is equivalent to 6.2 miles.

Note:
Reading off graphs is a simple skill, but make sure to read the question carefully. Students often make the mistake of reading from the wrong axis!
Reading Off Graphs Example Questions
Question 1: The conversion graph below can be used to convert between pounds (lbs) and kilograms (kg).
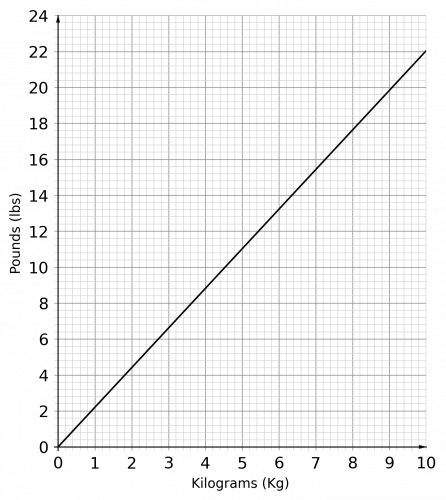 Use the graph to convert 12 lbs into kg.
[1 mark]
Draw a line from 12 lbs on the vertical axis to the graph. Draw a second line down from the graph to the horizontal axis:

As shown in the graph, 12 lbs is equivalent to 5.4 kg.

Question 2: Use the following graph to find the value of y when x=4
[1 mark]
Go to the value of x=4 on the horizontal (x) axis and draw a straight line up to the graph. Where the straight line meets the curve, draw a horizontal line across to the vertical (y) axis.
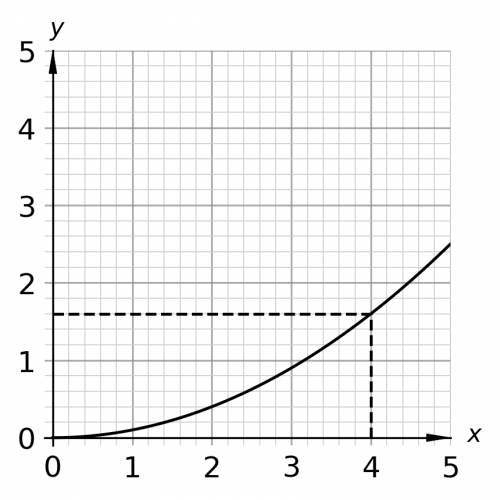
As shown in the graph above, y=1.6 when x=4
Question 3: The following graph can be used to convert temperature from degrees Celsius (\degreeC) to degrees Fahrenheit (\degreeF).
 Use the graph to convert the following:
a) 0\degreeC to \degreeF
b) 95\degreeF to \degreeC
[2 marks]
a) 0\degreeC is the beginning of the scale on the horizontal axis. At this point, the temperature in Fahrenheit is 32\degreeF
b) Draw a horizontal line across from 95\degree to the line of the graph. Draw a vertical line down from the graph to the horizontal axis.
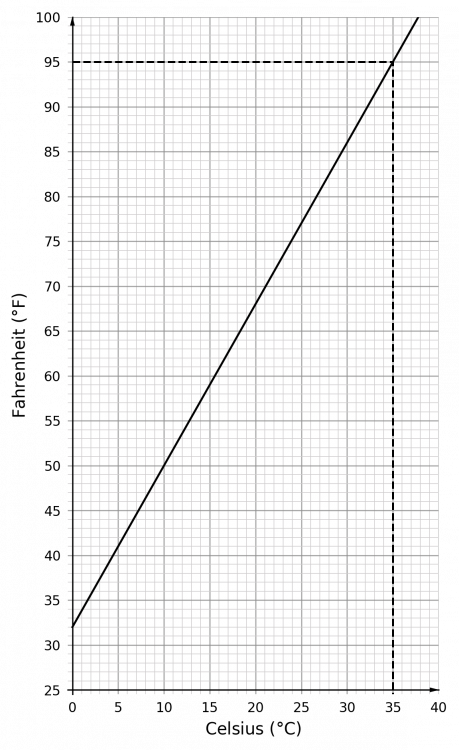
As shown on the graph, 95\degreeF is equivalent to 35\degreeC
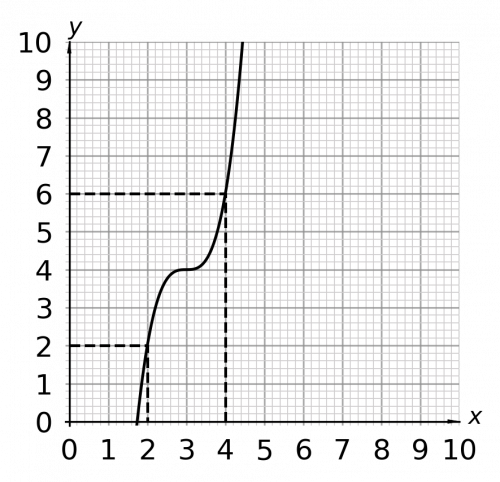
Question 4: Consider the following graph:
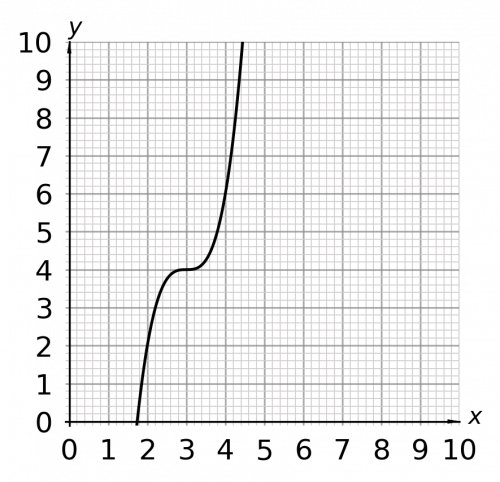
Use the graph to answer the following:
a) Give the value of y when x=2
b) Give the value of x when y=6
[2 marks]
a) Draw a vertical line up from x=2 to the graph. Then draw a straight line across to the y-axis. When x=2, y=2
b) Draw a horizontal line across from y=6 to the graph. Then draw a vertical line down to the x-axis. When y=6, x=4
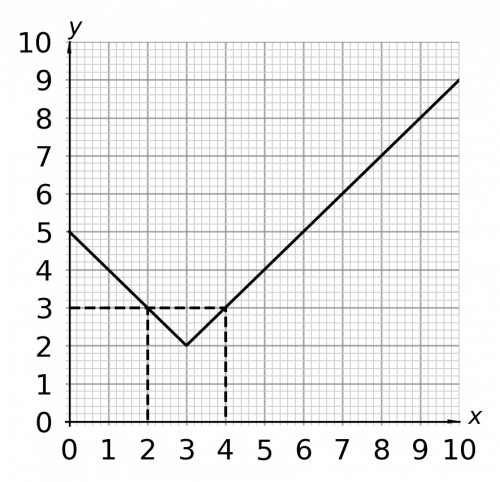
Question 5: Give the values of x when y=3
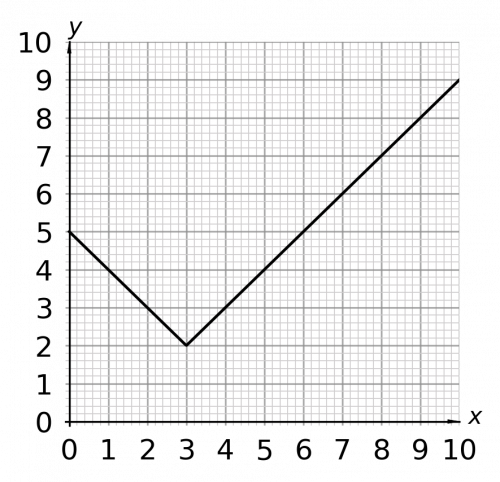
[2 marks]
This graph has an unusual shape, but we can still apply the same method to read the values we need.
Go to the value of 3 on the y-axis and then draw a horizonal line across to the graph. Note that there are two points where our line will cross the graph, so we will include both. Draw a vertical line down to the x-axis from these points. When y=3, x=2 and x=4