Probability Basics and Listing Outcomes
Probability Basics and Listing Outcomes Revision
Probability
Probability is the study of how likely things are to happen. We express the probability of an unknown event happening on a scale from certain to impossible, as a decimal, fraction or percentage.
Make sure you are happy with the following topics before continuing:

Probability Scale
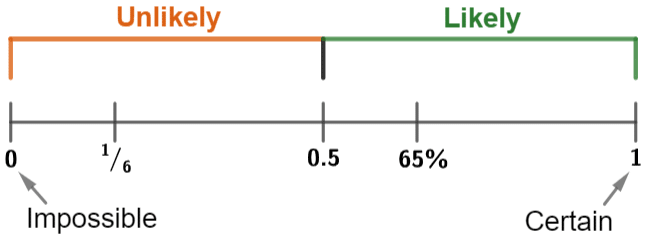
The probability (i.e. the chance) of something happening is defined on a scale from:
Impossible, 0 , there is a 0\% chance of that thing happening.
Certain, 1, there is a 100\% chance of that thing happening.
E.g. The probability that it will rain tomorrow is 65\%, this would be classed as likely
The probability that it will be foggy tomorrow is \dfrac{1}{6}, this would be classed as unlikely.

Probability Notation
To express “the probability of \text{X} happening” in a mathematical way, we write \text{P(X)}.
Example: The probability that I will watch a film tonight is 0.8
This can be written as \text{P(Film)} = 0.8
Calculating Probabilities
To calculate the probability, when all possible outcomes are equally likely, we can use the following formula:
\textcolor{Blue}{\text{Probability}} = \textcolor{Blue}{\text{P(X)}} = \dfrac{\text{number of ways an outcome can happen}}{\text{total number of possible outcomes}}
Example: Calculate the probability of rolling an even number on a fair \textcolor{black}{6} sided die.
- There are 3 even numbers, so there are 3 different, equally likely ways of rolling an even number.
- There are 6 numbers on a die, so there are a total of 6 possible outcomes.
\textcolor{blue}{\text{P(even)}} = \dfrac{\text{even numbers on a die}}{\text{total numbers on a die}} = \dfrac{3}{6} = 0.5
Probabilities Add Up to 1
If you consider all possible outcomes of an event (known as exhausting all options) then the probabilities must add up to 1
Example: The chance of flipping a coin and landing on heads is one half, and the chance of landing on tails is the same, one half. These are the only two possibilities (we’ve exhausted all options).
Adding these two up we get,
\text{P(heads)}+\text{P(tails)}=\dfrac{1}{2}+\dfrac{1}{2}=1
Sample Space Diagrams


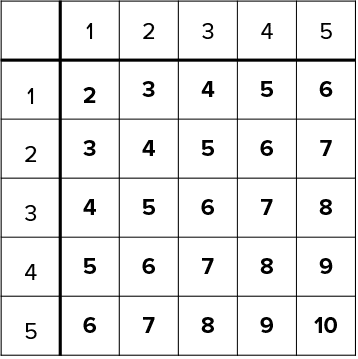
Listing outcomes is exactly what it sounds like – given a scenario, list every possible outcome. When there are two events taking place, we make use of a sample space diagram to help keep track of all the possible outcomes. This takes the form of a two way table.
Example: Megan spins two spinners numbered 1 to 5 and records the sum of the values each spinner lands on.


a) List all possible outcomes that Megan could find.
To do this we create and fill in a two way table to find every possible combination of scores from two spinners. As we can see there a total of 25 possible outcomes.
b) What is the probability of Megan recording a score of 8 or more?
All we have to do is count the number of squares on the table that have a score of 8 or more and make a fraction out of the total possible number of outcomes. There are 6 ways of getting this result.
This gives,
\text{P(8 or more)} = \dfrac{6}{25}
Systematic Listing
You may be asked to consider a scenario and list all of the possible outcomes there could be. The best way of doing this is systematically, or using systematic listing.
Listing options in a systematic way ensures you don’t miss out any possible outcomes.
Example:
A maths student is randomly selecting a three digit number containing the digits 1, 5 and 9.
List all possible outcomes of this selection.
As we are listing systematically, we need to list in a specific order. We will start with numbers beginning with 1,
159, 195
And now starting with 5,
519, 591
Finally, starting with 9,
915, 951
So the possible outcomes are,
159, 195, 519, 591, 915, 951
Product Rule
When there are a large number of outcomes or there are more than 2 events occurring, we can use the product rule to count the number of outcomes instead of listing all the possible outcomes, as this can take too long.
The product rule states that:
The total number of outcomes for 2 or more events is equal to the number of outcomes for each event multiplied together.
Example: A restaurant offers a set menu, that contains 3 starters, 8 main courses, and 4 desserts.
How many different ways are there to choose a three-course meal?
To do this, all we need to do is multiply the number of options together.
The number of different three-course meals = 3 \times 8 \times 4 = 96
Example:
Sarah and Charlie are playing a game, there are 3 possible outcomes for the game: Sarah wins, Charlie wins, or it’s a draw.
The chance of Sarah winning is 0.6, a draw is half as likely as Sarah winning.
What is the probability that Charlie wins?
[2 marks]
Probability of a draw = half the probability that Sarah wins:
\text{P(draw)}=0.6\div 2=0.3
Exhausting all options, we know that \text{P(Sarah wins)}, \text{P(draw)}, and \text{P(Charlie wins)} must all add up to 1, so
\begin{aligned} 0.6+0.3+\text{P(Charlie wins)}&=1 \\ 0.9+\text{P(Charlie wins)}&=1\end{aligned}
Then, subtracting 0.9 from both sides of the equation, we get
\text{P(Charlie wins)}=1-0.9=0.1
Probability Basics and Listing Outcomes Example Questions
Question 1: A spinning wheel is made up of 3 different sections, section A, section B and section C.
\text{P(A)}=55\%
\text{P(B)}=\dfrac{2}{5}
Work out the probability of the wheel stopping on section C.
[2 marks]
Since A, B, and C are the only possible outcomes, their probabilities must add up to 1.
Therefore, if we take both \text{P(A)} and \text{P(B)} away from 100\% or 1, we can work out \text{P(C)}, the probability of the wheel stopping section C.
The only issue presented to us in this question is that the probability of the wheel stopping in section A is given as a percentage, whereas for section B it is expressed as a fraction. We will therefore need to convert either the fraction to the percentage or the percentage to the fraction so that the two probabilities are expressed in the same way.
Although you can turn a percentage to a fraction quite easily, in this question it is probably easier to convert the fraction \frac{2}{5} to a percentage (provided you know what the percentage value of \frac{1}{5} is):
\frac{1}{5} = 20\%
so
\frac{2}{5} = 40\%
Since the probability of the wheel stopping in section A is 55\%, and the probability of the wheel stopping in section B is 40\%, that means we can calculate the probability of the wheel stopping in either section A or B:
\text{P(A)}+\text{P(B)}= 55\% + 40\% = 95\%
This therefore means that chance of the wheel stopping in section C can be calculated as follows:
100\% - 95\% = 5\%
(An answer expressed as a decimal (0.05) or as a fraction \frac{1}{20} is also acceptable.)
Question 2: When Jimmy decides to go to the cinema, he will either go to watch a sci-fi movie, a horror movie, or a romantic comedy. The probability he chooses a romantic comedy is 0.56. There is an equal chance that he picks a horror movie or a sci-fi movie. Find:
a) the probability Jimmy chooses a sci-fi movie
b) the probability Jimmy choose a sci-fi movie or a romantic comedy
[4 marks]
a) We know that the probability of Jimmy watching a romantic comedy is 0.56. Therefore we can easily calculate the probability of Jimmy not watching a romantic comedy:
1 - 0.56 = 0.44
This figure of 0.44, the probability of Jimmy not watching a romantic comedy, is the same probability as Jimmy watching either a horror film or a sci-fi movie.
Since the probability of Jimmy watching a sci-fi movie or a horror film is equal, then the probability of Jimmy watching a sci-fi movie must be half of this amount:
0.44 \div2 = 0.22
b) From part a), we know that the probability of Jimmy watching a sci-fi movie is 0.22.
The probability of Jimmy watching a romantic comedy is 0.56.
In order to calculate the probability of Jimmy watching either a romantic comedy or a sci-fi movie we need to add the probabilities of each, since this is an either / or scenario:
0.22 + 0.56 = 0.78
Question 3: Macy is deciding what colour trousers and what colour jumper to wear. Her choices are given below.
Trouser colours: black, navy, purple
Jumper colours: orange, yellow, white
If she chooses to wear black trousers and a yellow jumper, that would be denoted as BY.
List all other possible outcomes for Macy’s choice of outfit.
[3 marks]
If Macy chooses black trousers, then she has 3 choices for the colour of her jumper, so the 3 possible outcomes are:
BO, BY, BW
If she chooses navy trousers, then the 3 possible outcomes are:
NO, NY, NW
Finally, if she chooses purple trousers, then the remaining possible outcomes are:
PO, PY, PW
BY was already given in the question, so the full list of other possible outcomes is:
BO, BW, NO, NY, NW, PO, PY, PW
Question 4: A bag contains beads that are either red, blue, or green. Work out the probability of:
a) picking a blue bead out of the bag
b) picking a green bead out of the bag

[4 marks]
a) We know that the probability of selecting a red, blue or green bead must add up to 1. We know that the probability of selecting a red bead is 0.25, so the probability of selecting either a blue or a green bead must be:
1 - 0.25 = 0.75
The problem in this question is that the probability of selecting a blue bead and the probability of selecting a green bead is not the same. Selecting a blue bead has a probability 5x and selecting a green bead has a probability of 4x. This means that the probability of selecting a blue or green bead is:
5x + 4x = 9x
Since we know that the probability of selecting a blue or green bead is 0.75, we can therefore conclude that 9x = 0.75
If
9x = 0.75
then
x = 0.75 \div 9 = \dfrac{1}{12}
If the probability of selecting a blue bead is 5x, and x = \dfrac{1}{12}, then the probability of selecting a blue bead is \dfrac{5}{12}.
b) If the probability of selecting a green bead is 4x, and x = \dfrac{1}{12}, then the probability of selecting a blue bead is \dfrac{4}{12}. This fraction can then be simplified to \dfrac{1}{3}
Question 5: Some numbered raffle tickets are placed in a hat. The tickets are numbered 1 to 50 inclusive. A ticket is selected at random. What is the probability:
a) that the ticket is a multiple of 5 or an odd number?
b) that the ticket is a factor of 48?
[4 marks]
a) We know that the tickets are only numbered between 1 and 50, so we need to work out how many of these fall into the category of being either a multiple of 5 or an odd number.
There are 25 odd numbers in total between 1 and 50:
1, \, 3, \, 5, \, 7, \, 9, \, 11,\, 13,\, 15, 17, \, 19, \, 21, \, 23, \, 25, \, 27, \, 29, \, 31, 33, \, 35, \, 37, \, 39, \, 41, \, 43, \, 45, \, 47, \, 49
There are 10 multiples of 5 between 1 and 50: 5, \, 10, \, 15, \, 20, \, 25, \, 30, \, 35, \, 40, \, 45, \, 50
However, some of these multiples of 5 also feature on the odd number list, so cannot be counted twice. So, ignoring the odd multiples of 5, there are only 5 multiples of 5 remaining.
25 \text{ odd numbers} + 5 \text{ (even) multiples of } 5 = 30 \text{ numbers in total}
If 30 of the 50 numbers fall into the category of being either odd or a multiple of 5, then as a fraction we can express this as:
\dfrac{30}{50} which can be simplified to \dfrac{3}{5}
It is also perfectly acceptable to express the probability as a decimal or as a percentage:
\dfrac{3}{5} as a decimal is 3 \div 5 = 0.6
\dfrac{3}{5} as a percentage is 3 \div 5 \times 100 = 60\%
b) The factors of 48 are as follows:
1 and 48
2 and 24
3 and 16
4 and 12
6 and 8
(If you are ever working out the factors of a number, write them in pairs, and start at 1.)
This means that 10 numbers out of the 50 in the hat are factors of 48. We can express this as a fraction:
\dfrac{10}{50} which can be simplified to \dfrac{1}{5}
It is also perfectly acceptable to express the probability as a decimal or as a percentage:
\dfrac{1}{5} as a decimal is 1 \div 5 = 0.2
\dfrac{1}{5} as a percentage is 1 \div 5 \times 100 = 20\%
Probability Basics and Listing Outcomes Worksheet and Example Questions
(NEW) Probability Basics and Listing Outcomes Exam Style Questions - MME
Level 1-3GCSE
MME Premium Membership
£19.99
/monthLearn an entire GCSE course for maths, English and science on the most comprehensive online learning platform. With revision explainer videos & notes, practice questions, topic tests and full mock exams for each topic on every course, it’s easy to Learn and Revise with the MME Learning Portal.
Sign Up Now


