Grouped Frequency Tables
Grouped Frequency Tables Revision
Grouped Frequency Tables
Sometimes when we’re dealing with a lot of data at once, it’s easier to separate the values into groups. Then, we can display it in what is called a grouped frequency table. In order to succeed with grouped frequency table questions, it is worth revising the following topics:
Grouped Frequency With Equal Class Width
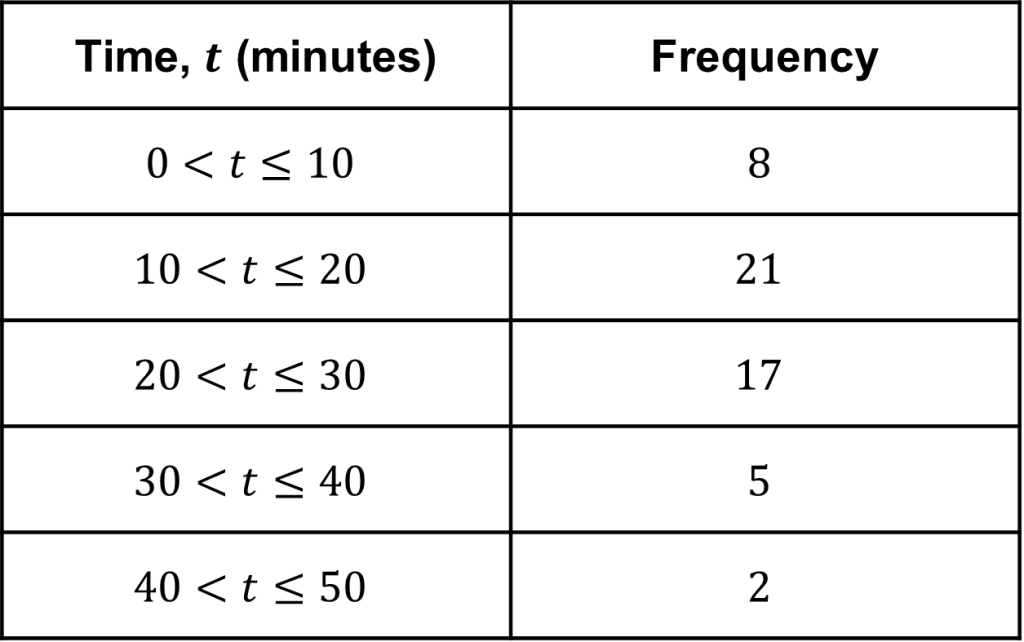

The table on the left shows the time (in minutes) taken for some students to complete their maths homework.
As we can see, the class widths are equal, with all the times being categorised into 10 minute intervals.
Looking at the grouped frequency table, we can see that it took 5 students more than 30 minutes but less than or equal to 40 minutes to complete their maths homework.
Using the data, we are able to find the modal class, or in other words the time interval in which the most students completed their homework within.
In this case, the modal interval is 10<t\leq 20
We cannot make a more accurate statement for the mode of the data, as we don’t know the specific times it took each student to complete their homework.
Grouped Frequency Tables
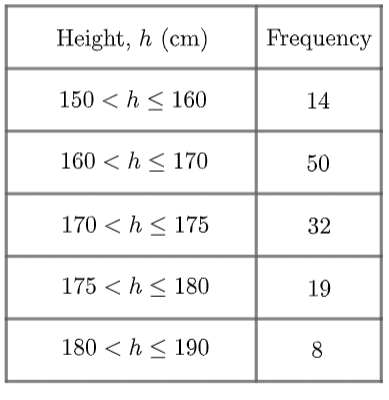

This particular example is a set of data on the heights of a selection of adults. To understand what this table is saying, let’s look at the first group (also known as a class):
150<h\leq 160
This notation means that all people who fall within this group are
“taller than 150 cm but no taller than 160 cm.”
It’s important to understand that this group doesn’t include people who are exactly 150 cm tall, but it does include people who are exactly 160 cm tall.
This distinction matters, because we have to be clear about which group people on the edges of their class will fit into.
So, we know there are 14 people who are taller than 150 cm but no taller than 160 cm. We don’t know how tall each of those 14 people were, only that they fall in that group. This is the disadvantage of grouped frequency tables.
Example: Grouped Frequency Mode


The grouped frequency table below shows data on the weights of 117 cats.
Find the modal class.
[1 mark]
Modal class: Here we must find the class which has the highest frequency – this is the modal class. Here, this is 3.5 < w \leq 4.
Example: Grouped Frequency Median
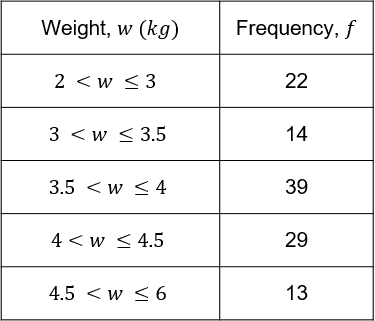

The grouped frequency table below shows data on the weights of 117 cats.
Find the class containing the median.
[2 marks]
There are 117 cats in total, so the median is the \dfrac{117 + 1}{2} = 59\text{th} cat.
Since 22+14=36<59 and 22+14+39=75>59, the median class must be 3.5<w\leq4.
Grouped Frequency Tables Example Questions
Question 1: Joe has a herb garden. He measures the heights of all the plants in his herb garden. Their heights, in centimetres, are given below.
32,39,9,35,21, 22,25,32
51,33,7,19,19,55,31,37
27,28,46,30,25,38,61,15
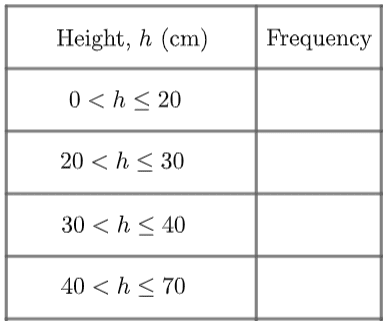
Using Joe’s information, complete the grouped frequency table below:
[2 marks]
There are several good ways to do this question, one of which is to cross off each number as you go, and tally them in the appropriate groups.
For clarity, here is a full list of heights for each group.
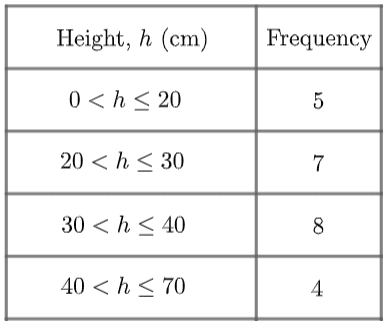
The 0<h\leq 20 group:
7,9,15,19,19
The 20<h\leq 30 group:
21,22,25,25,27,28,30
The 30<h\leq 40 group:
31,32,32,33,35,37,38,39
The 40<h\leq 70 group:
46,51,55,61
So, the completed table should look like this:
Question 2: 100 people were given a puzzle to solve.
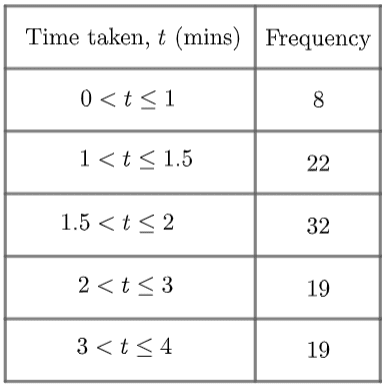
Their times, in minutes, are recorded in the grouped frequency table below:
a) State the number of people who took over 2 minutes to complete the puzzle.
b) If you complete the puzzle in 90 seconds or less, you win a prize. Work out the proportion of the people taking the test who win the prize. Give your answer as a fraction in its simplest form.
[2 marks]
a) The bottom two groups in the table amount to the total number of people who took over 2 minutes. Therefore, the total number of people who took over 2 minutes to solve the puzzle is:
19+19=38\text{ people}
b) First of all, we need to convert 90 seconds to minutes.
90\div60=1.5\text{ minutes}
We now need to look for the number of people who took up to 1.5 minutes to solve the test. The first two groups in the table represent the people who completed the puzzle in under 90 seconds, so the total can be calculated as follows:
8+22=30\text{ people}
If 30 people out of 100 completed the puzzle in under 90 seconds, then this can be written as the following fraction:
\dfrac{30}{100}
This fraction can be simplified to:
\dfrac{3}{10}
Question 3: A physics test is marked out of 60. Here are the marks for the 25 students:
26,11,21,35,44,23,37, 16,42,11,47,59,45,16,13,18, 19,25,15,32,54,8,38,42,53
a) Complete the grouped frequency table below to show the marks:
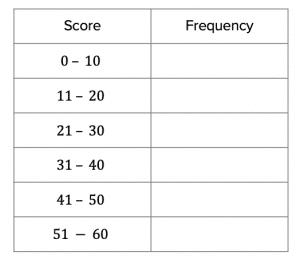
b) What percentage of the class scored above 40 marks?
[3 marks]
a) Probably the easiest way to complete the frequency table is to use tally marks, crossing off each mark as you go through the list.
The completed frequency table should like this:
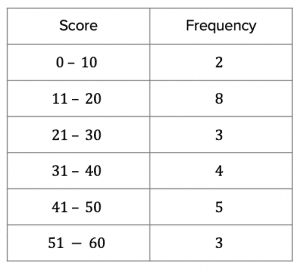
b) This question is asking for the percentage of students who scored above 40 (that is 41 marks or more). We can see from the frequency table that 5 students scored between 41 and 50 marks and 3 students scored between 51 and 60 marks. Therefore, 8 students in total scored above 40.
Since there are 25 students in total, of which 8 scored higher than 40, we can write this as the following fraction:
\dfrac{8}{25}
We need to convert this to a percentage. To do this (if you are unsure) divide the numerator by the denominator and multiply by 100, as follows:
8\div25\times100 = 32\%
Question 4: Mr Smith asks his form group who they would like to select as their form captain. Every member of the form group votes and the results are as follows:
Gemma, Abigail, Gemma, Gemma, Abigail, Gemma, Dawn, Abigail, Sophie, Gemma, Dawn, Sophie, Gemma, Elizabeth, Sophie, Abigail, Leanne, Tanya, Dawn, Gemma, Sophie, Dawn, Leanne, Dawn, Elizabeth, Sophie, Dawn, Leanne, Tanya, Gemma, Elizabeth, Elizabeth
a) Complete the grouped frequency table below:
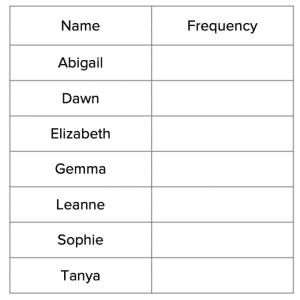
b) What fraction of the class did not vote for Gemma?
[3 marks]
a) Probably the easiest way to complete the frequency table is to use tally marks, crossing off each name as you go through the list.
The completed frequency table should like this:
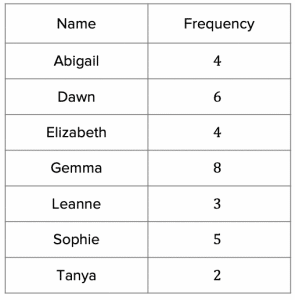
b) If we add up the totals in the frequency column, this grand total will represent the total number of students in the form group:
4+6+4+8+3+5=32\text{ students}
If 8 out of the 32 students voted for Gemma, this can be written as the following fraction:
\dfrac{8}{32}
This fraction can be simplified to:
\dfrac{4}{16}
This can again be simplified to:
\dfrac{2}{8}
This can again be simplified to:
\dfrac{1}{4}
Therefore, if \frac{1}{4} of the students voted for Gemma, then \frac{3}{4} of the students did not vote for her.
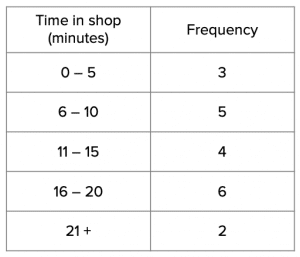
Question 5: A bike shop owner recorded the amount of time, in minutes, customers spent in his bike shop, and he recorded the following times:
16,23,4,9,4,18,45,20,8,6,3, 14,12,17,12,19,9,16,10,15
a) Complete the frequency table below:
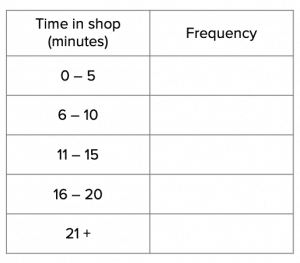
b) The customers who spent more than 10 minutes in his shop spent on average £12.50 each. How much money did the bike shop owner receive from the customers who were in his shop for 10 minutes or longer?
c) What fraction of the customers spent more than 10 minutes, but less than 21 minutes, in his shop?
[4 marks]
a) Probably the easiest way to complete the frequency table is to use tally marks, crossing off each time as you go through the list.
The completed frequency table should like this:
b) From our frequency table, we need to find the rows that correspond to customers who were in the shop for 10 minutes or more.
4 people spent between 11 and 15 minutes, 6 people spent between 16 and 20 minutes and 2 people spent over 20 minutes.
Therefore the number of people who spent more than 10 minutes in the bike shop is 4+6+2=12 customers.
If their average spend was £12.50 each, then to work out the total spent by these 12 customers, we simply need to multiply this amount by 12:
\pounds12.50\times12 = \pounds150
c) We are looking for customers who spent more than 10 minutes, but less than 21 minutes, so we need to add together the total from the 11 – 15 minute row and the 16 – 20 minute row. This comes to a total of 4+6=10 customers.
If we add up the frequency column we know that in total there were 3+5+4+6+2=20 customers in total. If 10 out of the 20 customers spent more than 10, but less than 21 minutes, then this cam be written as the following fraction:
\dfrac{10}{20}
This fraction can easily be simplified to:
\dfrac{1}{2}
Grouped Frequency Tables Worksheet and Example Questions
(NEW) Grouped Frequency Tables Exam Style Questions
Level 4-5GCSENewOfficial MMEGrouped Frequency Tables Drill Questions
Averages From Frequency Tables - Drill Questions
Level 4-5GCSE
MME Premium Membership
£19.99
/monthLearn an entire GCSE course for maths, English and science on the most comprehensive online learning platform. With revision explainer videos & notes, practice questions, topic tests and full mock exams for each topic on every course, it’s easy to Learn and Revise with the MME Learning Portal.
Sign Up Now
