Graph Transformations
Graph Transformations Revision
Graph Transformations
A transformation is something that is done to a graph/function that causes it to change in some way. This topic is about the effects that changing a function has on its graph.
There are two types of transformation: translations and reflections, giving 4 key skills you must be familiar with. Throughout this topic, we will use the notation f(x) to refer to a function and describe the changes that happen to it.
Make sure you are happy with the following topics before continuing:
Skill 1: Translation in the x-axis
Translation in the x-axis is a shift left or right.
These look like: f(x + a); where a is added to each input before it is passed into the function, changing all values of x everywhere in the question.
As a result, the whole graph is translated by a in the negative x direction (left):
+a Translates Left
-a Translates Right

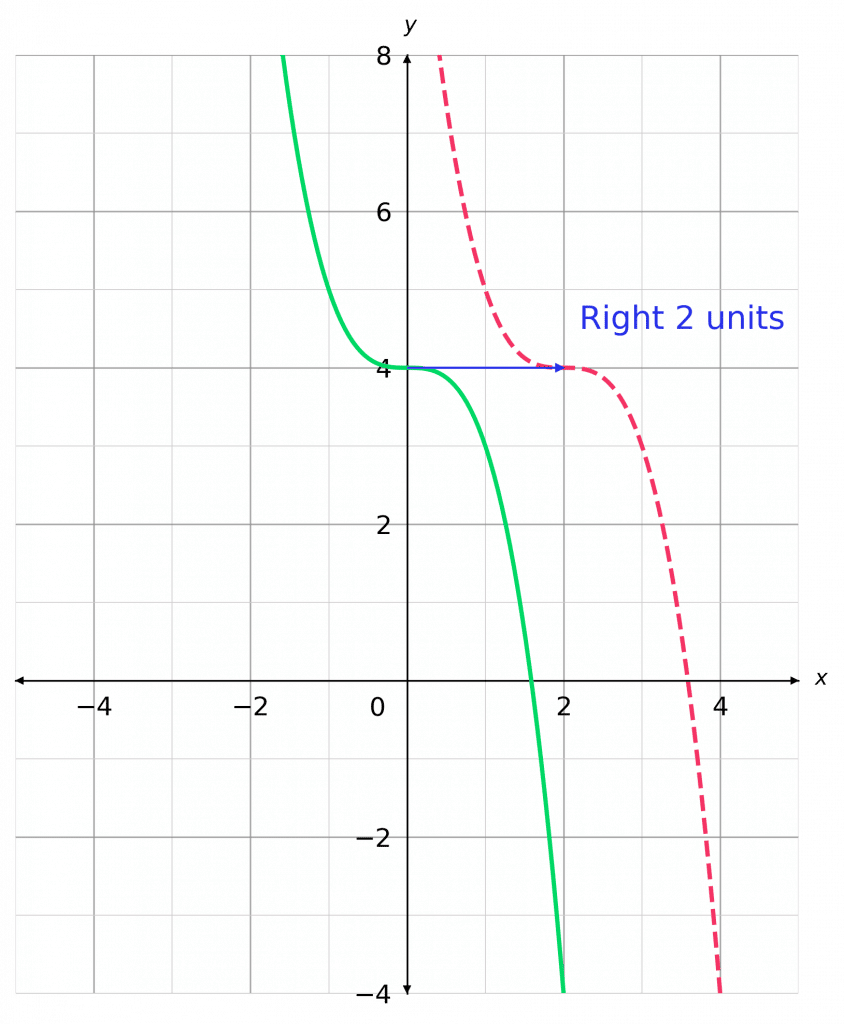
For instance on the axis shown:
y = \textcolor{limegreen}{-x^3+4}
and
y = \textcolor{limegreen}{-(x}\textcolor{blue}{-2}\textcolor{limegreen}{)^3+4}
\textcolor{blue}{-2} means 2 units to the right.
Skill 2: Translation in the y-axis
Translation in the y-axis is a shift up or down.
These look like f(x) + a; where the function adds the value of b on top of all of its outputs.
This means that the y values on the graph (the outputs of the function) are all increased by a.
As a result, the whole graph is translated by a in the positive y direction (up).
+a Translates Up
-a Translates Down

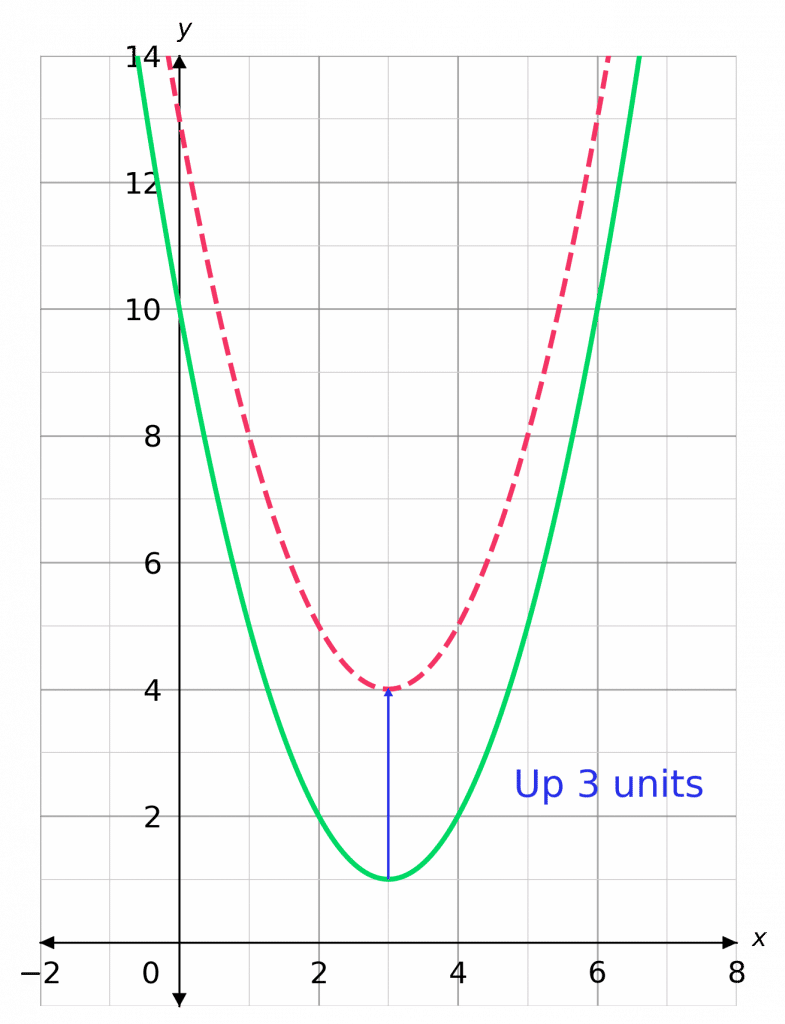
For instance:
y =\textcolor{limegreen}{(x-3)^2 +1}
and
y=\textcolor{limegreen}{(x-3)^2 +1}\textcolor{blue}{+3} = \textcolor{red}{(x-3)^2 + 4}
Skill 3: Reflection in the x-axis
When a function/graph is reflected in a line, everything on one side of the line is flipped over and swapped with everything on the other side of the line.
This looks like -f(x); in this case, every positive y value is made negative and every negative y is made positive. As a result, the whole graph is reflected in the \bm{x}-axis.

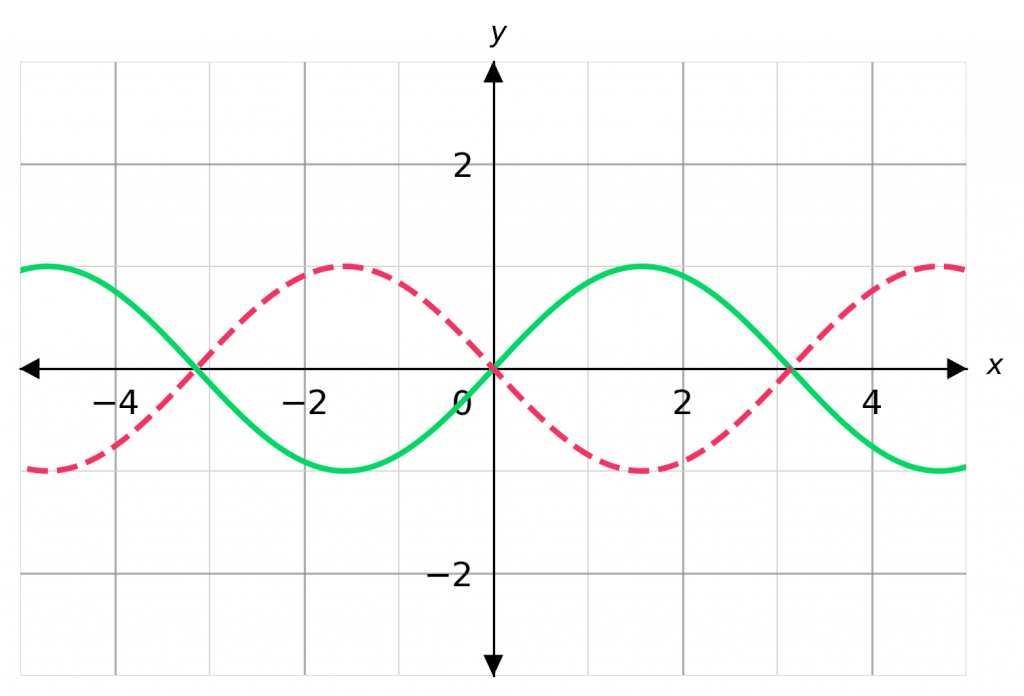
For instance:
y = \textcolor{limegreen}{\sin(x)}
and
y=\textcolor{red}{\bf{-}}\textcolor{limegreen}{\sin(x)}
Skill 4: Reflection in the y-axis
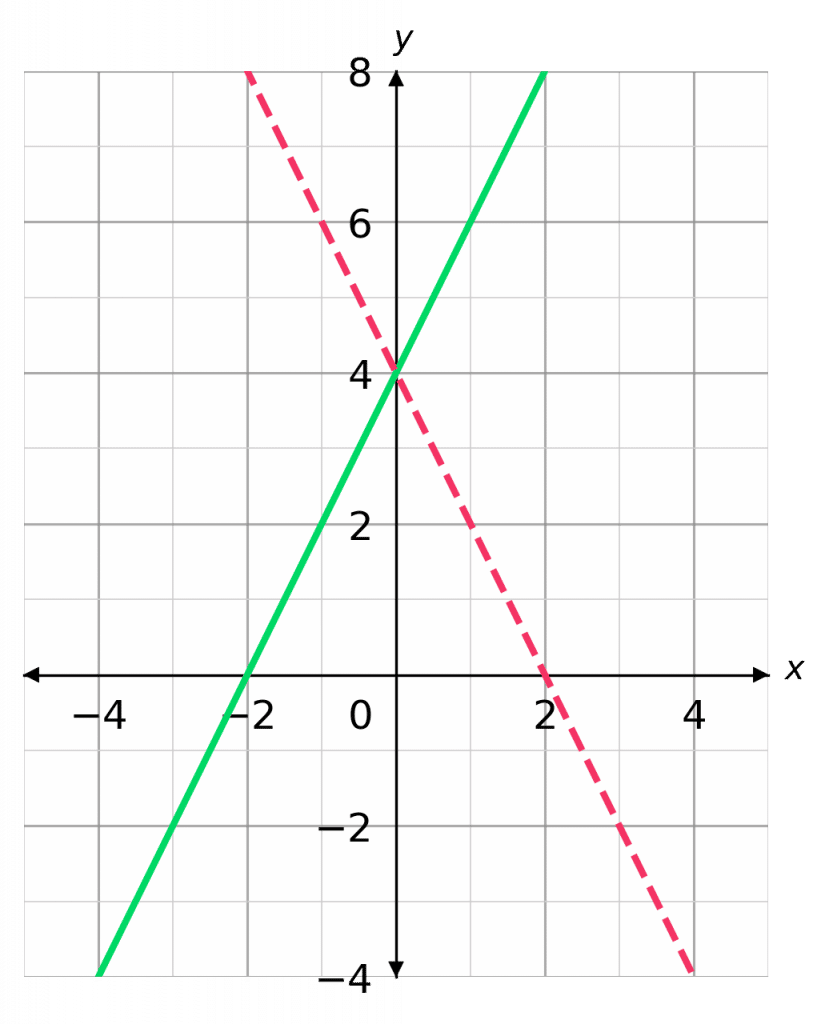
These look like f(-x); in this case, every positive x value is made negative and every negative x is made positive. As a result, the whole graph is reflected in the \bm{y}-axis.

For instance:
y = \textcolor{limegreen}{2x+4}
and
y=\textcolor{red}{\bf{-}}\textcolor{limegreen}{2x+4}
Example 1: Translations
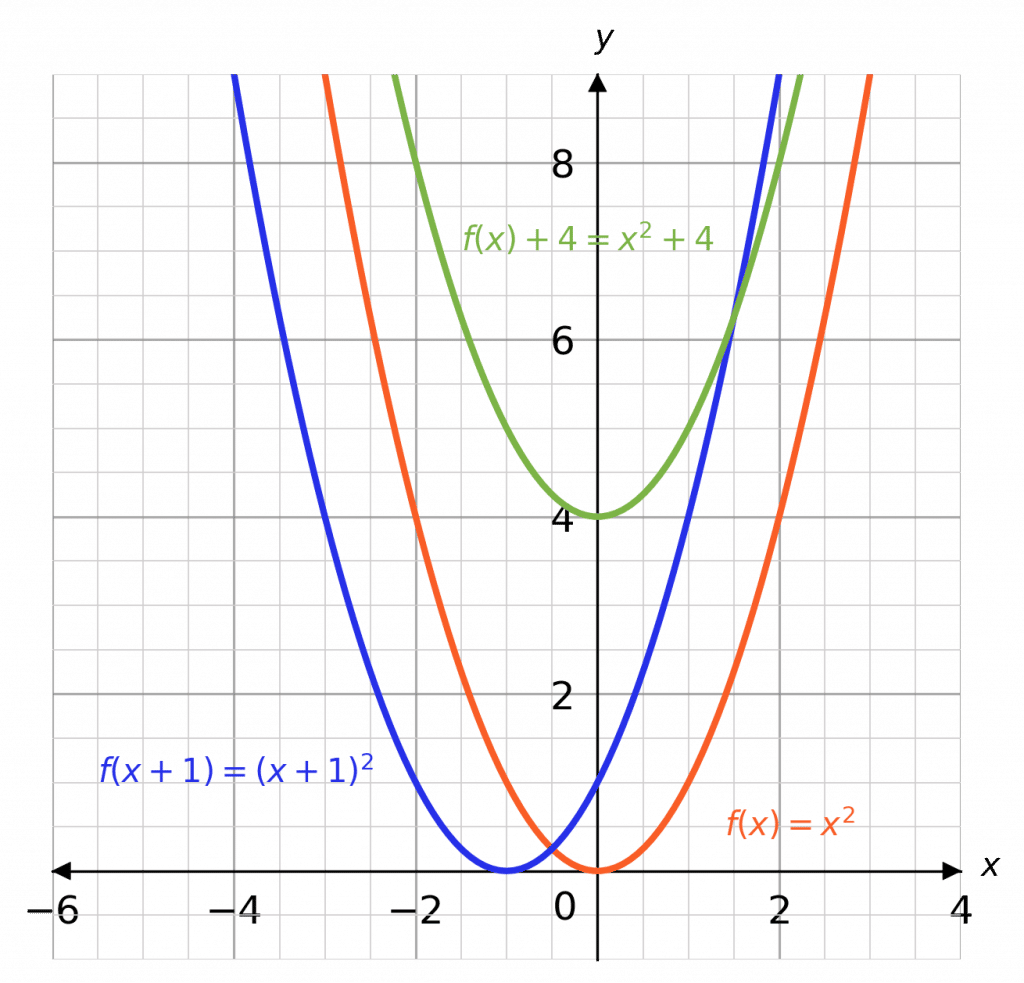
Let \textcolor{Orange}{f(x) = x^2}. Sketch, on the same axes, the graphs of \textcolor{Orange}{f(x)}, \textcolor{limegreen}{f(x) + 4}, and \textcolor{blue}{f(x + 1)}.
[3 marks]
Firstly, you should recall the parabolic shape of the graph \textcolor{Orange}{y=x^2}.
Now, in the case of the graph
\textcolor{limegreen}{f(x) + 4 = x^2 + 4},
every y coordinate is increased by 4 and thus the whole graph is shifted upwards by 4.
In the case of the graph
\textcolor{blue}{f(x + 1) = (x + 1)^2},
every x coordinate is decreased by 1, and thus the whole graph is shifted left by 1. The resulting graphs should look like those in green and blue (respectively).

Example 2: Reflections
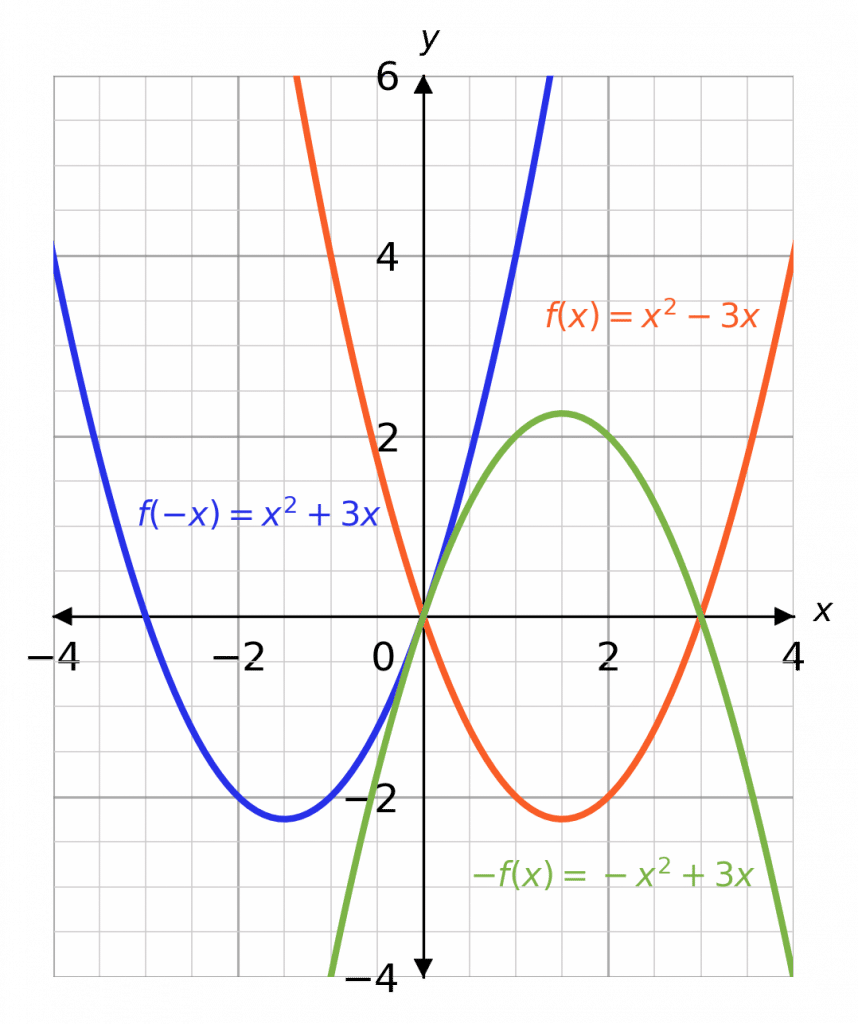
Let \textcolor{Orange}{f(x) = x^2 - 3x}. Sketch, on the same axes, the graphs of \textcolor{Orange}{f(x)}, \textcolor{blue}{f(-x)}, and \textcolor{limegreen}{-f(x)}.
[3 marks]

Now, in the case of the graph
f(-x)= (-x)^2 - 3(-x) = \textcolor{blue}{x^2 +3x},
every positive x coordinate is made negative and vice versa, and thus the whole graph is reflected in the y-axis.
In the case of the graph
-f(x) = -(x^2 - 3x) = \textcolor{limegreen}{-x^2 + 3x},
every positive y coordinate is made negative and vice versa, and thus the whole graph is reflected in the x-axis. The resulting graphs should look like those in blue and green (respectively).
Graph Transformations Example Questions
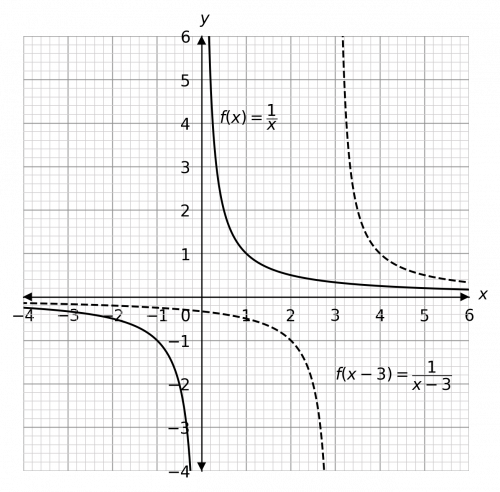
Question 1: Let f(x) = \dfrac{1}{x}. Sketch, on the same axes, the graph of f(x - 3).
[2 marks]
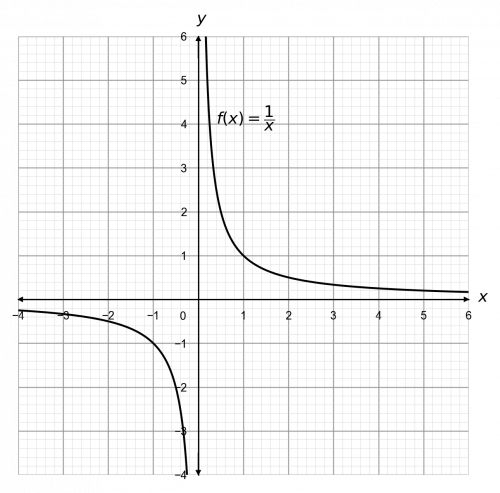
If you don’t recall the shape of the reciprocal graph, click here (Plotting Quadratics and Harder Graphs).
Now, f(x - 3) = \dfrac{1}{x - 3} is a translation of positive 3 in the x-direction. So, we get
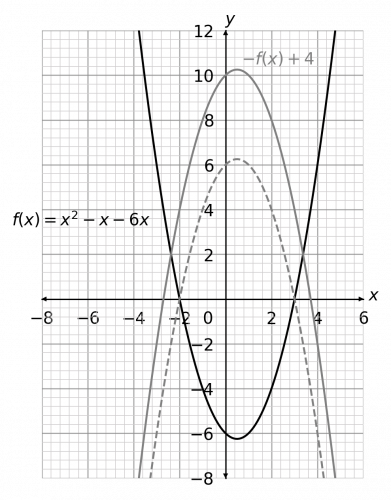
Question 2: Let f(x) = x^2 - x - 6. Sketch, on the same axes, the graph of -f(x) + 4.
[2 marks]
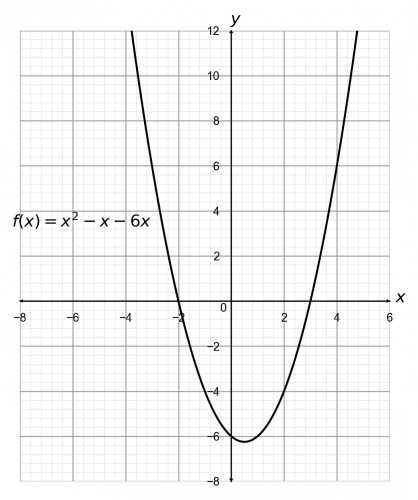
Firstly, x^2 - x - 6 factorises to (x - 3)(x + 2), so it is a positive quadratic with roots at 3 and -2.
Now, -f(x) + 4 is both a reflection in the x-axis and a translation of 4 in the positive y-direction. We should do the reflection first and the translation second – it often helps to sketch the intermediate step to help you, and you can always rub it out afterwards. Here, the dotted line will be the intermediate step (the reflection before the translation). So, we get
Bonus questions: What would happen if you did the translation first and then the reflection? How would this answer be different, or would it be different at all?
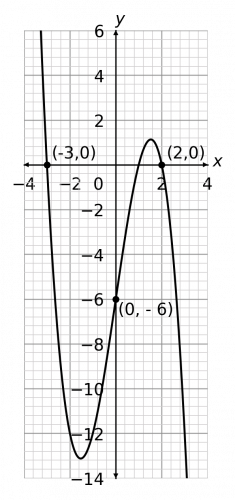
Question 3: Below is a graph of f(x) with 3 coordinates (-3, 0), (0, 6), and (2,0) marked on. Sketch f(-x), and mark on the new locations of these points.
[2 marks]
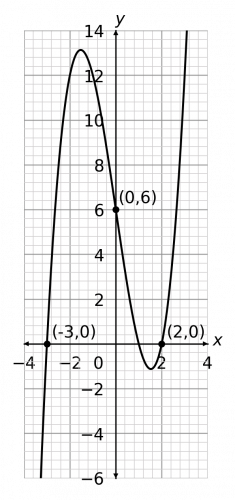
So, f(-x) means a reflection in the y-axis. In terms of the individual coordinates, the negative x values will be made positive and the positive x values will be made negative. So, we get
Graph Transformations Worksheet and Example Questions
(NEW) Graph Transformations Exam Style Questions - MME
Level 6-7GCSENewOfficial MMEGraph Transformations Drill Questions
Graph Shifts and Stretches (Mixed) - Drill Questions
Level 8-9GCSETransformation Of Graphs - Drill Questions
Level 8-9GCSEGraph Transformations x-Stretch x-shift - Drill Questions
Level 8-9GCSEGraph Transformations y-Stretch y-shift - Drill Questions
Level 6-7GCSE
MME Premium Membership
£19.99
/monthLearn an entire GCSE course for maths, English and science on the most comprehensive online learning platform. With revision explainer videos & notes, practice questions, topic tests and full mock exams for each topic on every course, it’s easy to Learn and Revise with the MME Learning Portal.
Sign Up Now
