Frequency Trees
Frequency Trees Revision
Frequency Trees
A frequency tree is used to show how a group of people/things can be broken up into certain categories.
Make sure you are happy with the following topics before continuing.
Constructing Frequency Trees
Data from experiments that have 2 or more steps can be recorded using a frequency tree. For example:


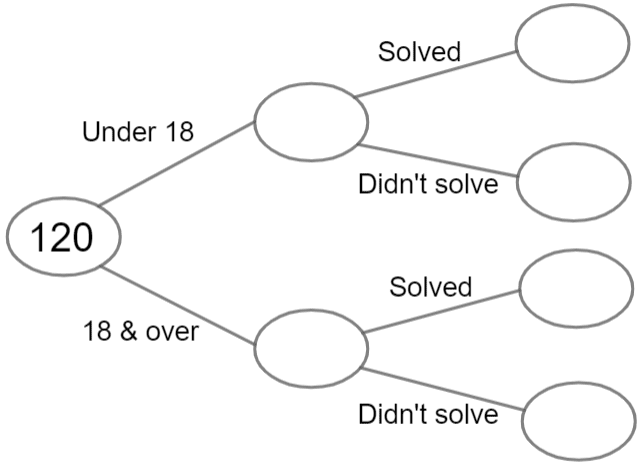
120 people were given 3 minutes to solve a puzzle.
- 45 people who tried to solve the puzzle were under 18 years old.
- 78 people solved the puzzle.
- 32 people aged 18 and over did not solve the puzzle.
Complete the frequency tree using this information.
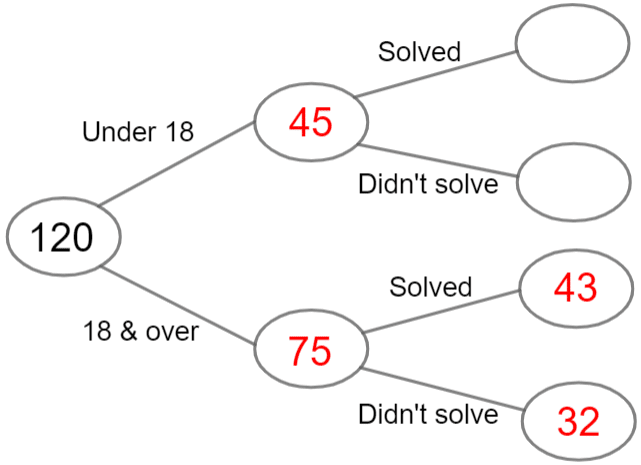
Step 1: \textcolor{red}{45} of the people in question were under 18.
The total number of people is 120. We can now work out the following.
\text{‘18 and over’ people }=120-45=\textcolor{red}{75}


We can now add these to the frequency tree.
Step 2: ‘\textcolor{red}{32} people aged 18 & over did not solve the puzzle’.
We know \textcolor{red}{32} people aged 18 and over did not solve the puzzle, so this can be added to the frequency diagram.
Next, we calculate how many people aged 18 and over solved the puzzle.
\text{‘18 and over’ and ‘solved puzzle’ }=75-32=\textcolor{red}{43}
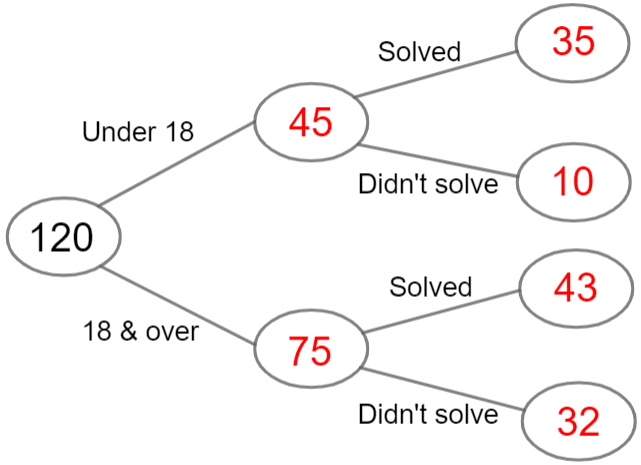
Step 3: For the final two blank spaces, we can’t simply use the same technique as before, we have to look at the second bit of information:
We know ‘78 people solved the puzzle’


We now know how many of the ‘18 and over’ group solved the puzzle, so
\text{‘under 18’ and ‘solved puzzle’ }=78-43=\textcolor{red}{35}
Lastly, this number and the ‘under 18 – didn’t solve’ group must add up to 45, so we get
\text{‘under 18’ and ‘didn’t solve puzzle’}=45-35=\textcolor{red}{10}
Using Frequency Trees
We can now use the frequency trees we have created to answer probability questions.
Example: Using the frequency tree from the previous example, if you choose one of the under 18s at random, what is the probability that they did not solve the puzzle?
Leave your answer in its simplest form.
From our diagram we can see that there are 45 under 18s, 10 of which didn’t solve the puzzle. Therefore, the probability is
\dfrac{10}{45}=\dfrac{2}{9}
This fraction is now in its simplest form, so we’re done.
Frequency Trees Example Questions
Question 1: 200 people travelled to an event by bus or by train.
58 people travelled by train.
Of the people who travelled by bus, 40 were late.
71 people were late to the event.
Complete the frequency tree.
[3 marks]

Since there were 200 people in total, of which 58 travelled by train, we can calculate how many travelled by bus:
200-58=142 \text{ travelled by bus }
We are also told that of the total number of people who travelled by bus – which we now know is 142 people – 40 were late. If we know how many were late, we can easily work out how many who travelled by bus were not late:
142-40=102 \text{ by bus and on time}
So, that leaves two remaining bubbles in the tree diagram, the ones branching off from the 58 people who took the train.
The question tells us that 71 people in total were late to the event. Given that 40 of those people who were late took the bus, we can calculate how many of these people who were late took the train:
71-40=31\text{ late by train}
Finally, if 31 of the 58 people who took the train were late, we can calculate how many took the train and were on time
58-31=27\text{ by train and on time}
The completed frequency tree should therefore look like this:

Question 2: 75 people are either right-handed or left-handed.
63 of them are right-handed.
One third of left-handed people are right-footed.
27 people are left-footed.
a) Complete the frequency tree.
b) If a right-handed person is picked at random, what is the chance that they are right-footed?
c) If a person is picked at random, what is the chance that they are right-footed? Leave your answer in its simplest form.
[6 marks]

a) First of all, if there are 75 people in total and 63 are right-handed, we can perform a simple calculation to work out how many people are left-handed:
75-63=12 left-handed people
Secondly, we know that of the left-handed people, one third are right-footed. So the number of people who are left-handed and right-footed can be calculated as follows:
12\div 3=4 left-handed and right-footed people
Furthermore, since there are 12 left-handed people in total, we can now work out how many of them are left-footed:
12-4=8 left-handed and left-footed people
So, we just have two remaining bubbles, the ones branching off from the 63 right-handed people.
The final piece of information given to us in the question tells us that 27 people in total are left-footed. Given that we now know that 8 of the left-handed people are left-footed, we can calculate the number of people who are right-handed and left-footed:
27-8=19 right-handed and left-footed people
Finally, if 19 of the 63 right-handed people are left-footed, we can calculate how many are right-handed and right-footed
63-19=44 right-handed and right-footed people
The completed frequency tree should therefore look like this:

b) There are 63 people who are right-handed, and 44 of them are right-footed. So, the probability of picking a right-handed person who is also right-footed is
\dfrac{44}{63}
c) There are 75 people in total. The number of right-footed people is:
44+4=48
Therefore, the probability of selecting a right-footed person is:
\dfrac{48}{75}
This fraction can be simplified to:
\dfrac{16}{25}
Question 3: At Grange Hill School for Boys, the year 11s took either French or Spanish for GCSE.
65\% of the year group took French.
\frac{1}{12} of the students who took French failed, which was 13 students in total.
The total number of students who failed Spanish was twice the number of students who failed French.
a) Complete the frequency tree.
b) To the nearest whole number, what percentage of the whole year group passed French?
[4 marks]

a) We have very little information to go on here, but since we know that 13 students failed French and that this was \frac{1}{12} of the entire French group, we can work out how many students took French:
12 \times13 = 156\text{ French students in total}
If 156 students took French and 13 failed, then the number that passed was:
156-13=143\text{ took French and passed}
We are also told that 65\% of the year group took French. This represents 156 students. From this information, we can calculate the total number of students in the year group and then the number of students who took Spanish.
If
65\% = 156\text{ students}
then
1\% = 156\div65\text{ students}
so
100\% = 156\div65\times100\text{ students}
156\div65\times100=240\text{ students}
Therefore, there was a total of 240 student in year 11 that took French or Spanish.
Since 35\% of the year group took Spanish, the exact number that took Spanish can be calculated as follows:
0.35 \times 240\text{ students} = 84\text{ Spanish students}
We are told that the number of students who failed Spanish was twice the number that failed French. Since 13 failed French, we can work out the number that failed Spanish:
2\times13 = 26\text{ failed Spanish}
Therefore the number that passed Spanish can be calculated as follows:
84-26=58\text{ passed Spanish}
The completed frequency tree should therefore look like this:

b) We know that the total in the year group was 240 students. Of these 240, 143 passed French. As a percentage, this can be calculated as follows:
\dfrac{143}{240}\times100=60\%\text{ to the nearest whole number}
Question 4: Pupils at sports day were given a choice of a ham or cheese sandwich, which they could have on either white or brown bread.
15\% of the pupils who chose a cheese sandwich opted for brown bread. 18 children opted for a cheese sandwich on brown bread.
The number of pupils who chose a cheese sandwich and the number of pupils who chose a ham sandwich can be given as a ratio of 2 : 3. Of the people that chose a ham sandwich, \frac{3}{10} opted for brown bread.
a) Draw a frequency tree to represent this information.
b) What is the probability of selecting a student at random who chose a ham sandwich on brown bread?
[4 marks]

a) The first fact that we are presented with is that 15\% of the pupils chose a cheese sandwich on brown bread and that this figure represents a total of 18 pupils. From this information, we can work out the total number of pupils who had a cheese sandwich.
If
15\% = 18\text{ pupils}
then
1\% = 18 \div15\text{ pupils}
so
100\% = 18 \div15 \times 100\text{ pupils}
18 \div15 \times 100 = 120\text{ pupils who chose cheese}
If 120 pupils chose a cheese sandwich, and 18 of them had brown bread, then we can easily calculate the number that had a cheese sandwich on white bread:
120-18 = 102\text{ cheese sandwich on white bread}
The next key piece of information we are given is that the ratio of pupils who chose a cheese sandwich to pupils who chose a ham sandwich is 2 : 3. From this information we can deduce that \frac{2}{5} of these pupils had a cheese sandwich and \frac{3}{5} of this pupils had a ham sandwich. (We are dealing in fifths here because the sum of the ratio is 5.)
If
\dfrac{2}{5} = 120\text{ pupils}
then
\dfrac{1}{5} = 60\text{ pupils}
so
\dfrac{3}{5} = 180\text{ pupils}
Therefore we can conclude that a total of 180 students chose a ham sandwich.
At this point we now also know that there was a total of 300 pupils:
120\text{ cheese} + 180\text{ ham} = 300\text{ pupils total}
Finally, we know that of the people that chose a ham sandwich, \frac{3}{10} opted for brown bread. We can now calculate exactly how many pupils this is since we have now worked out the number of students who opted for the ham sandwich:
\dfrac{3}{10}\times180 =54\text{ ham sandwich on brown bread}
The number of students who had a ham sandwich on white bread is simply the total that chose a ham sandwich minus the 54 who chose a ham sandwich on brown bread:
180-54=126\text{ ham sandwich on white bread}
The completed frequency tree should therefore look like this:

b) We know from the completed frequency tree that there was a total of 300 pupils and that a total of 52 pupils chose a ham sandwich on brown bread. The probability of selecting a pupil at random from the group who chose a ham sandwich on brown bread can be expressed as follows:
\dfrac{54}{300}
This can be simplified to:
\dfrac{27}{150}
This can again be simplified to:
\dfrac{9}{50}
Question 5: In a recent election, the votes for three parties, The Conservative Party, the Labour Party and the Green party, were shared in a ratio of 7 : 6 : 3.
The votes cast by men and by women for the Labour party were in a ratio of 3 : 2.
The total number of people who voted for the Green Party was 24,750.
The number of female votes received by the Green party was 65\% of the total number of female votes received by the Labour party.
The number of male votes received by the Conservative Party was 40\% more than the total of male votes received by the Labour party.
Draw a frequency tree to represent this information.
[4 marks]

In this question, we have a couple of ratios and some percentages, but the only precise figure we have to start with is the total number of people who voted for the Green Party.
We know that the votes were shared between the 3 parties in the ratio of 7 : 6 : 3. This means that the Conservative Party received \frac{7}{16} of the votes, the Labour party \frac{6}{16} and the Green Party \frac{3}{16}. (We are dealing in sixteenths here because the sum of the ratio is 16.)
If 24,750 voted for the Green party and this represented \frac{3}{16} of the total number of votes received, then we can work out the total number of votes:
If
\dfrac{3}{16} = 24,750\text{ votes}
then
\dfrac{1}{16} = 24,750\div3\text{ votes}
so
\dfrac{16}{16} = (24,750\div3)\times 16\text{ votes}
(24,750\div3)\times 16=132,000\text{ votes}
So, if there was a total of 132,000 votes, we can work out the number of votes received by the Conservative party and the Labour party.
The total number of votes received by the Conservative party was:
\dfrac{7}{16}\times132,000=57,750\text{ votes}
The total number of votes received by the Labour party was:
\dfrac{6}{16}\times132,000=49,500\text{ votes}
We know that votes cast by men and by women for the Labour party were in a ratio of 3 : 2. This means that \frac{3}{5} of the votes were cast by men and \frac{2}{5} by women. (We are dealing in fifths here because the sum of the ratio is 5.)
Since we know the total number of votes received by the Labour party and the fraction cast by men and women, we can work out the exact number of votes made by each gender.
The total number of votes cast by men was:
\dfrac{3}{5}\times49,500=29,700\text{ votes}
The total number of votes cast by women was:
\dfrac{2}{5}\times49,500=19,800\text{ votes}
We are also told that the number of female votes received by the Green party was 65\% of the total number of female votes received by the Labour party. Since the total number of female votes received by the Labour party was 19,800, we simply need to work out 65\% of this amount:
0.65\times19,800 = 12,870\text{ votes}
Since the Green party received 24,750 votes in total, we can work out the number of male votes:
24,750-12,870=11,880\text{ male votes}
The final thing to work out is the number of male and female votes received by the Conservative Party. We know that the number of male votes was 40\% more than the total of male votes received by the Labour party. The total number of male votes received by the Labour party was 29,700, so we will need to increase this figure by 40\%, as follows:
29,700\times1.4 = 41,580\text{ male votes}
If the Conservative party received 57,750 votes in total, of which 41,580 were male, then the number of female votes can be calculated as follows:
57,750-41,580=16,170\text{ female votes}
The completed frequency tree should, therefore, look like this:

Frequency Trees Worksheet and Example Questions
(NEW) Frequency Trees Revision Exam Style Questions - MME
Level 1-3GCSENewOfficial MME
MME Premium Membership
£19.99
/monthLearn an entire GCSE course for maths, English and science on the most comprehensive online learning platform. With revision explainer videos & notes, practice questions, topic tests and full mock exams for each topic on every course, it’s easy to Learn and Revise with the MME Learning Portal.
Sign Up Now


