
Revise
Gradients of Straight Line Graphs
Gradients of Straight Line Graphs
You will need to be able to work out how steep straights lines on an x–y graph are.
What a gradient specifically tells us is the rate of change of y with respect to x. This is usually denoted, for a straight line, as a constant m. The higher the value of m the “steeper” the line is. The closer to 0, m is, the shallower the slope.
Gradients
As the gradient is the rate of change of y with respect to x, if the gradient is m, then for every 1 unit that x increases, y will increase by m units.
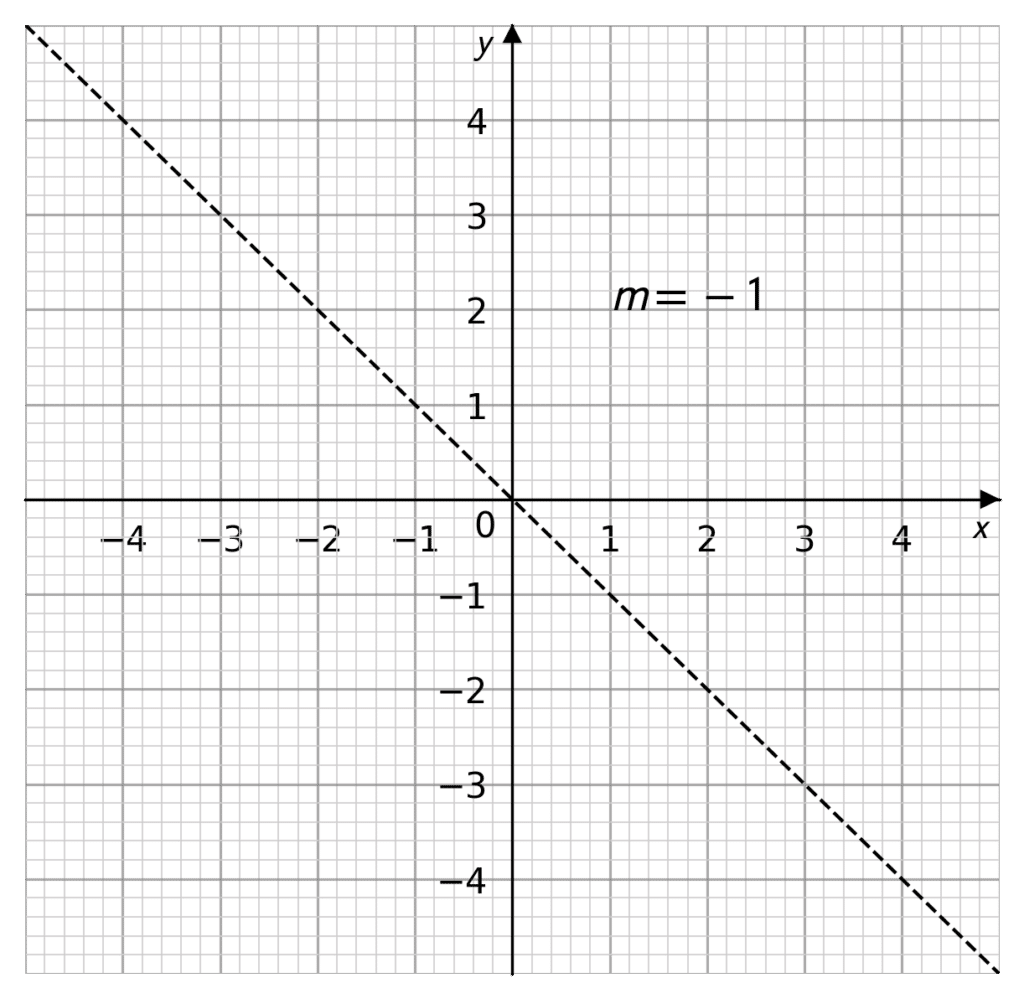
If m is negative, that means that while x is increasing, y is decreasing (m=-1 pictured).
Gradients can also be fractions, so if the gradient of a line is \dfrac{2}{3}, then for every increase of 3 to x, y is increased by 2.

Finding the Gradient – Graphically
In order to find the gradient we must find the difference in y, denoted \Delta y, and the difference in x, denoted \Delta x. So, for gradient m:
m = \dfrac{\text{Difference in } y}{\text{Difference in } x}=\dfrac{\Delta y}{\Delta x}
There are two ways we need to be able to find \Delta y and \Delta x.
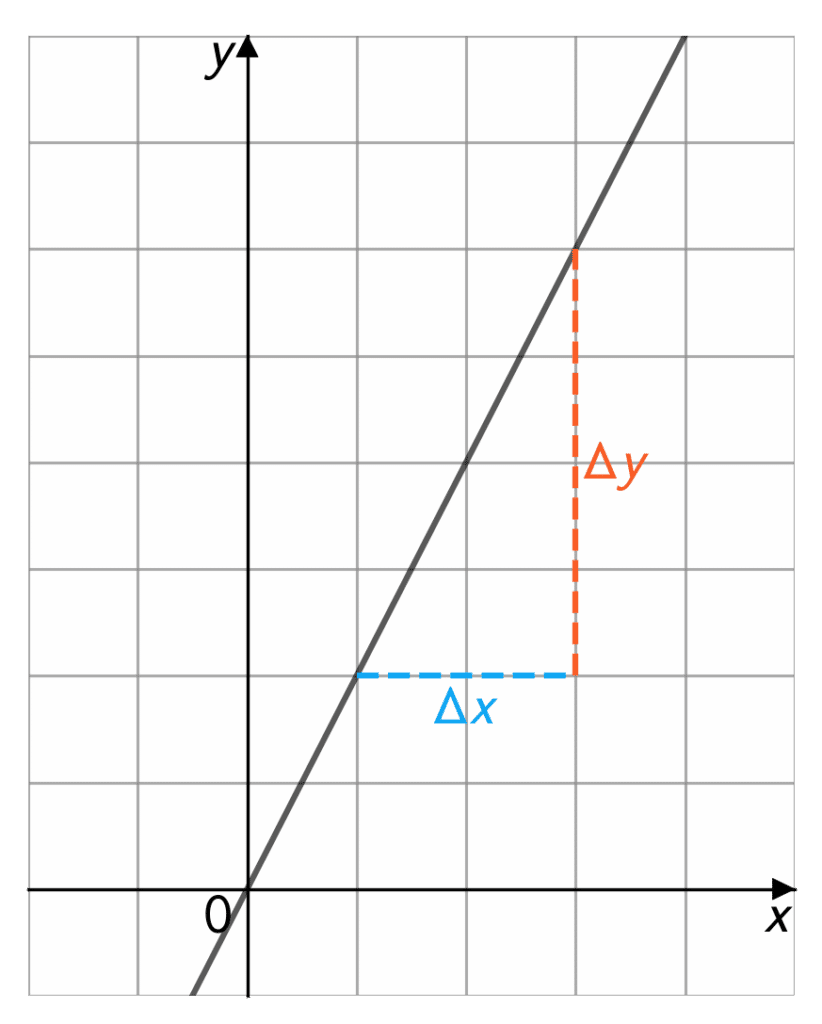
Firstly, graphically. The graph on the left shows how the differences can be interpreted. We can draw a right angled triangle that has the straight line as it’s hypotenuse. The width of this triangle is \Delta x , and it’s height is \Delta y.
So if each square in the graph is 1 unit by 1 unit, then \Delta y = 4 and \Delta x = 2. Which would give us a gradient of \dfrac{4}{2} = 2.

Finding the Gradient – Given 2 Points
The other way we must be able to find the gradient of a straight line is by having points with coordinates.
Between any two points in the x–y plane, we can draw a straight line that goes between them. So we can use the coordinates of those two points to find \Delta y and \Delta x, and as such, the gradient. So given two points on a straight line (x_1, y_1) and (x_2, y_2), then
\Delta y = y_2 - y_1
\Delta x = x_2 - x_1
and so for gradient m,
m = \dfrac{\Delta y}{\Delta x} = \dfrac{y_2-y_1}{x_2-x_1}.
Example 1: Finding a Gradient Graphically
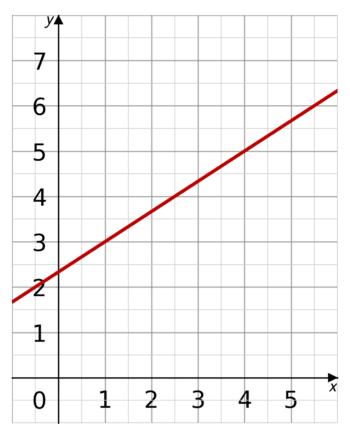
Find the gradient of the red line.
[2 marks]
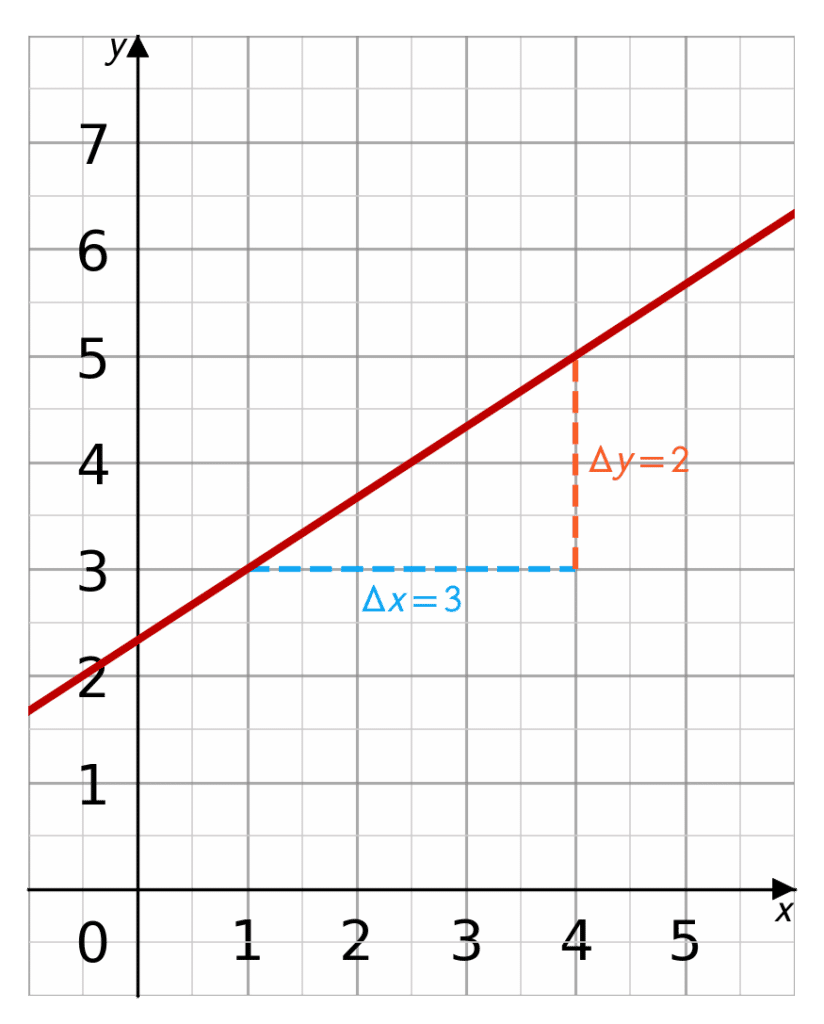
We can draw on our triangle, as shown by the dotted lines. The line passes through the points (1,3) and (4,5) so we can draw our triangle there.
We can count the units and see the triangle is 3 units wide and 2 units tall. This gives us
\Delta y = 2
\Delta x = 3
So the gradient, m is
m = \dfrac{\Delta y}{\Delta x} = \dfrac{2}{3}.
Example 2: Finding a Gradient from Coordinates
A straight line passes through the points (1,1) and (0, 13).
Find the gradient to this straight line.
[2 marks]
We shall first find
\Delta y = 13 - 1 = 12
\Delta x= 0 - 1 = -1.
So the gradient m is
m = \dfrac{\Delta y}{\Delta x}= \dfrac{12}{-1} = -12.
Gradients of Straight Line Graphs Example Questions
Question 1: Given the following graph:
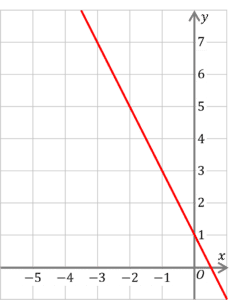
What is the gradient of the red line?
[2 marks]
Drawing a triangle from two points on the line, we can see
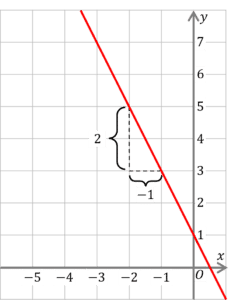
which gives us
\Delta y = 2
\Delta x = -1
So,
m=\dfrac{2}{-1}=-2

Question 2: Given the following graph:
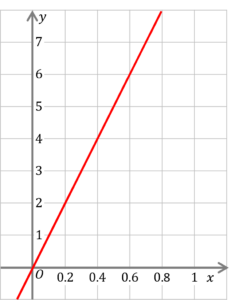
What is the gradient of the red line?
[2 marks]
Drawing a triangle from two points on the line, we can see
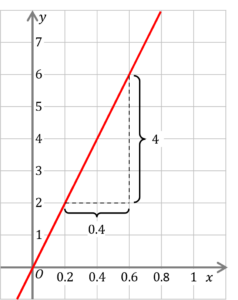
which gives us
\Delta y = 4
\Delta x = 0.4
So,
m=\dfrac{4}{0.4}=10
Question 3: Give the gradient for the straight line that passes through the points (1,3.5) and (10,71)
[2 marks]
We know
m=\dfrac{\Delta y}{\Delta x}
So we must find \Delta y and \Delta x
\Delta y = 71-3.5= 67.5
\Delta x = 10-1=9
So
m=\dfrac{67.5}{9}=\dfrac{15}{2} = 7.5
Question 4: Give the gradient for the straight line that passes through the points (16,2) and (32,1)
[2 marks]
We know
m=\dfrac{\Delta y}{\Delta x}
So we must find \Delta y and \Delta x
\Delta y = 1-2= -1
\Delta x = 32-16=16
So
m=-\dfrac{1}{16}.
Specification Points Covered
Cambridge iGCSE – C3 Coordinate geometry – C3.2
Cambridge iGCSE – E3 Coordinate geometry – E3.2