Data Collection
Data Collection Revision
Data Collection
Data can be separated into two different categories: primary data and secondary data.
Primary data is data that you have collected yourself, e.g. by conducting a survey within your class. If you have used data that someone else has collected, this is called secondary data, e.g. you have found data on a website.
When collecting primary data, it is important that you display it in a form which makes it easy to analyse and is suitable for the type of data that you have.
Different Types of Data
Qualitative Data
Qualitative data is the collection of non-numerical values, for example the names of students in a classroom or the different items on a food menu.
Quantitative Data
As expected, quantitative data measures quantities using numbers, for example recording the ages of people at a birthday party or the weights of some people.
There are two different types of quantitative data, which are:
Discrete Data – the values collected can only exact values. For example, the number of people sat in a restaurant can only be a whole number, it is impossible to have 37.6 people.
Continuous Data – the values collected can take any value in the given range. For example, the heights of children in a classroom could take any value within a sensible range, e.g. 1.34 \text{ m}.
Organising Data
When collecting data and displaying it in a table, it is almost always required to group the data found into classes, therefore making it easier to work with and analyse.
It is important that the classes you select do not overlap, whilst still covering all the possible values. This is to ensure that no data is accounted for twice or missed out.
For discrete data the classes will have gaps between them, e.g. 0-5 people, 6-10 people. This is because there can be no data between 5 and 6. However, for continuous data there can be no gaps, so they should be separated using inequalities.
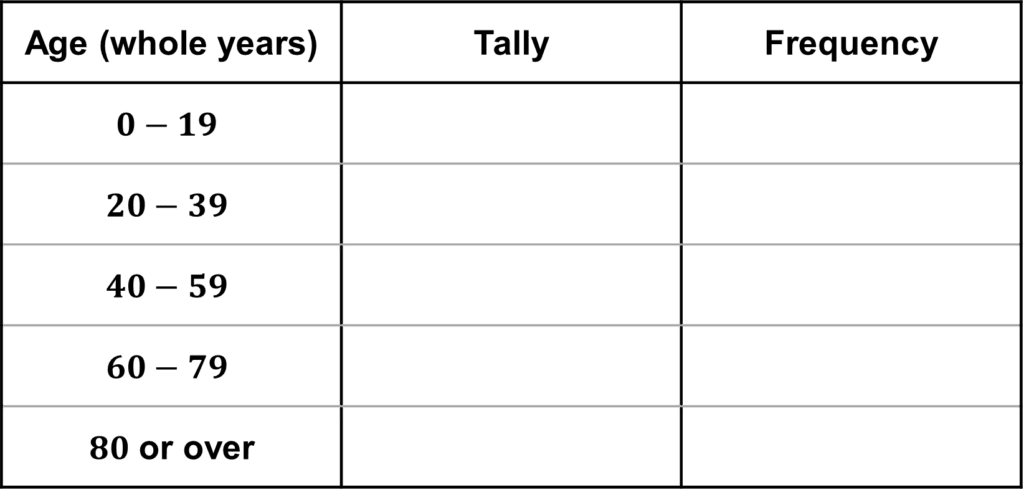
Example: Cohen wants to conduct a survey about the ages (in whole years) of people watching a film at the cinema.
Design a table he could use to collect and represent this data.

For the table to be used to both collect the data and show it, including a column for the ‘Tally‘ and a column for the ‘Frequency‘ is necessary.
As shown in the table on the right, none of the classes overlap, as there are gaps in between as this data will be discrete.
To make sure all options are covered for, it is sometimes required to use classes like ‘.. or less‘, ‘… or over‘ or ‘other‘. This allows you to include all possible values with a sensible number of classes.
Questionnaires
Asking people to complete a questionnaire is another method to record data.
To make sure your questionnaire can be used as a reliable source of data it needs to have:
- No ambiguous questions
- No overlapping questions
- Fair questions – i.e. not questions that are leading or contain some bias or opinion within them
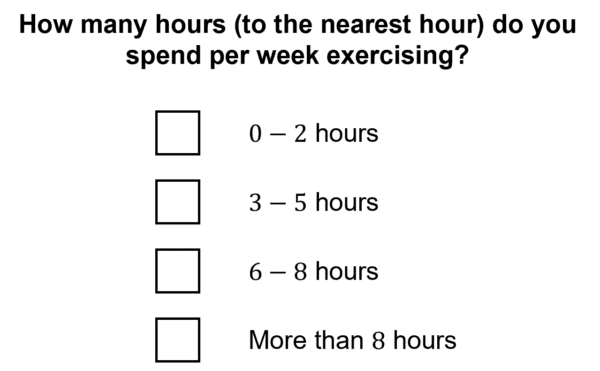
Example: Create a questionnaire to find out how much time some students spend exercising.
To make the data collected easier to use, it is mostly easier to use multiple choice questions that are split into classes. As mentioned previously, it is important that these classes do not overlap and that they also cover every possible scenario.
Furthermore, specifying a time frame for a questionnaire like this is imperative, otherwise your data collected will not be very useful to use as one person could have answered how much they exercise per day and another person could have interpreted it as how much they exercise per week.
Here is an example of a good questionnaire for this scenario.

Data Collection Example Questions
Question 1: Luke wants to collect some data about the time taken for some of his classmates to complete a running race.
Decide whether the data he collects will be discrete or continuous data.
Give a reason for your answer.
[1 mark]
The data that will be collected will be continuous data, as time is a continuous measurement, with an infinite amount of possible times in any given range.
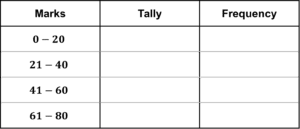
Question 2: A teacher wants to record the amount of marks achieved in a test by their students. The maximum number of marks is 80.
Design a suitable table they could use to collect this data.
[2 marks]
As this will be discrete data, there should be gaps between the classes, because marks can only be a whole number. We also know that a student cannot get more than 80 marks on the test, so using a class with ‘… or over’ in would be unnecessary.
Here is an example of a suitable table to use:

Question 3: Megan wants to find out how much money some university students spend of coffee.
She creates this questionnaire.

Write down two things wrong with this questionnaire.
[2 marks]
- The question doesn’t include a time frame for the amount of money spend on coffee.
- The classes overlap, which could cause data to be recorded twice or the same data to be recorded in different classes. For example, if someone spent £3 on coffee, they could tick the first or second option.
You May Also Like...

MME Learning Portal
Online exams, practice questions and revision videos for every GCSE level 9-1 topic! No fees, no trial period, just totally free access to the UK’s best GCSE maths revision platform.