
Revise

Maps and Scale Drawings
Maps and Scale Drawings
Maps are used all the time to help the person reading them understand how areas are laid out. A lot of maps you’ve seen will have been scale drawings – pictures where all the distances between locations on the map are in proportion to distances in real life.
For example, suppose we have a town where the church is mile from the school whilst the supermarket is miles from the school – twice the distance away. On a scale drawing of this town, the distance (on the drawing) between the supermarket and the school would still be twice the distance of the church from the school.
We can also use scale drawings in diagrams of real-life objects, where the dimensions on the diagram will be proportional to the real life object.
Skill 1: Understanding Scale Keys
Every scale drawing should come with a key – a statement that describes how much the object has been shrunk down to fit on the page, i.e. how much bigger the distances in real-life are than the distances on the page. This are a several ways this information can be displayed.
Some examples are shown on the cm grid below:
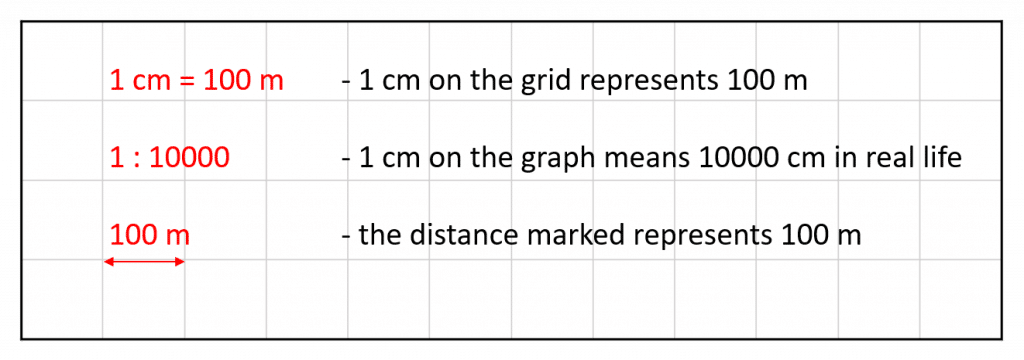
Each of the keys in the diagram means the same thing – they all indicate the same scale.

Notes:
You will be given a scale diagram with a grid background in some cases but not in others. The key will allow you to work out real-life distances in either case.

Skill 2: Calculating Distances by Measurement
Example: Below is a scale drawing of a portion of coastline. A boat sets off from point A and travels in a straight line to point B. Work out the distance covered by the boat.
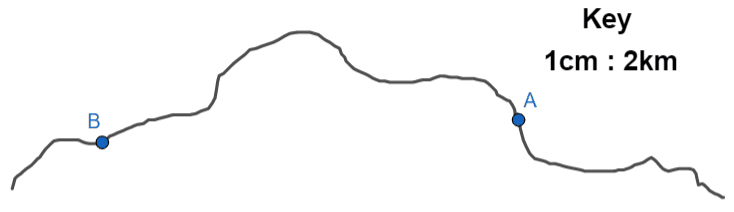
The key, shown in the top right, is telling us that every centimetre on the map represents km in real-life. So, we must firstly measure the distance between A and B on the picture.
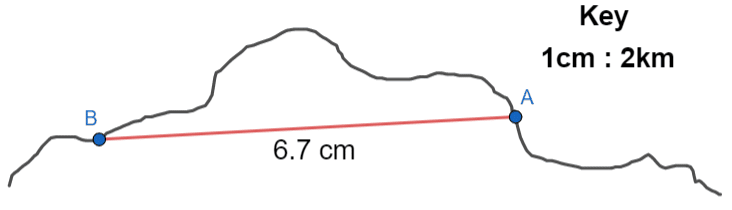
It’s important to measure as carefully as you can, because measuring with a ruler is relatively simple, so you will be deducted marks if you’re slightly out.
In this case, we see that the distance is cm. Since the key tells us that each cm is km, we get the real-life distance travelled by the boat to be:
Skill 3: Calculating Distances using a Grid
Sometimes scale drawings and maps are given using a grid. If the key is given in terms of the numbers of squares on the grid, we don’t need to use a ruler to work out real life distances.
Example: Below is a map of Australia and New Zealand. Calculate the real-life distance between the cities, Melbourne and Auckland, marked on the map.
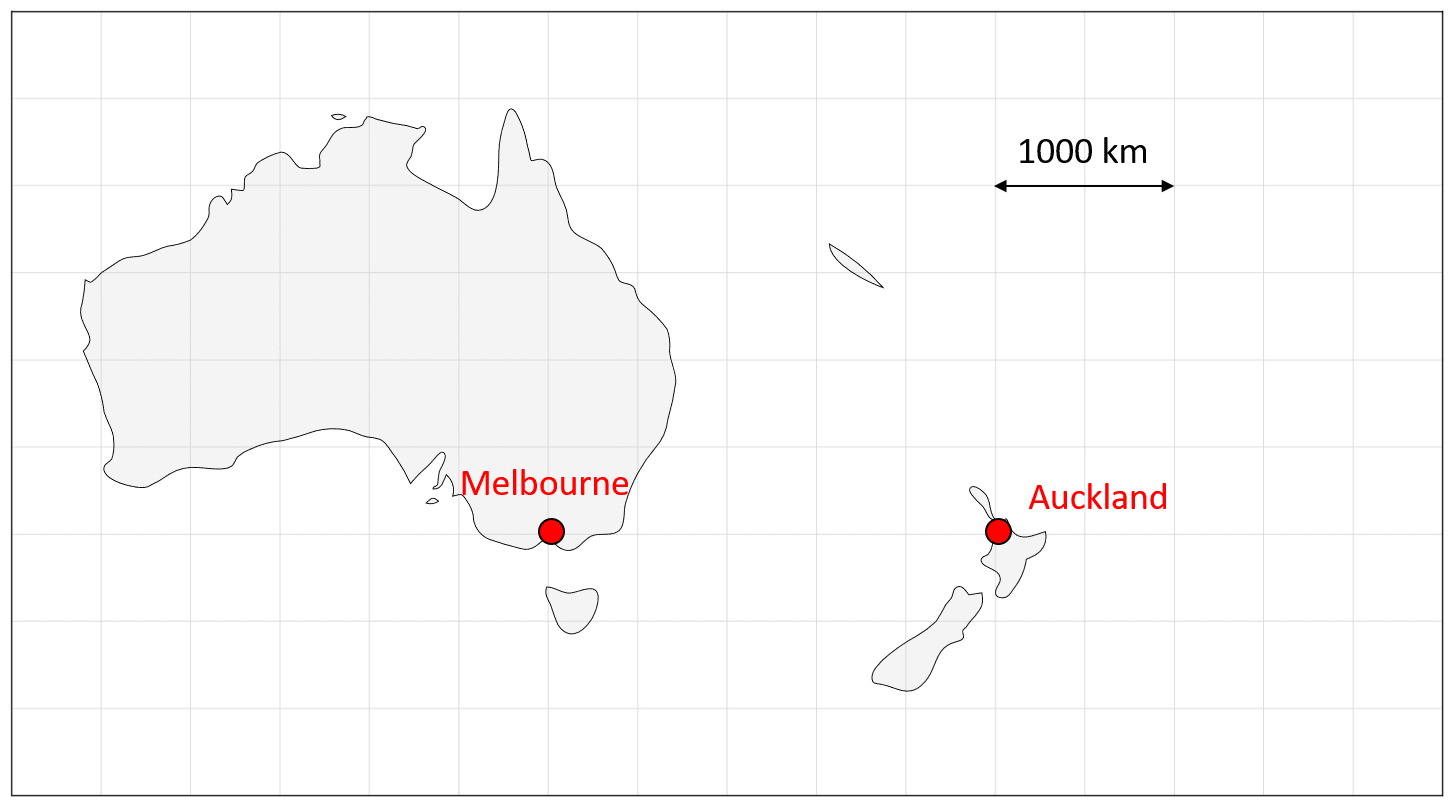
Here, we can use the scale given in the map:
A distance of two squares is equal to
We can calculate the distance represented by one square by dividing by :
Next, count the number of squares between the two cities on the map:
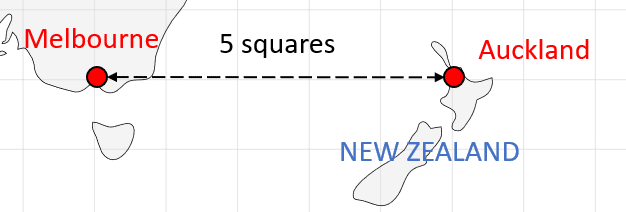
There are squares between Melbourne and Auckland on the map.
Finally, multiply the number of squares by the distance represented by one square on the map to calculate the actual distance between the two cities:
Skill 4: Calculating the Scale of a Diagram
In some instances, you may be asked to calculate the scale of a diagram if you are given the real-life dimensions. You should try to put your scale into the form “ cm …”
Example: The diagram below shows a scale drawing of a house that is m wide.
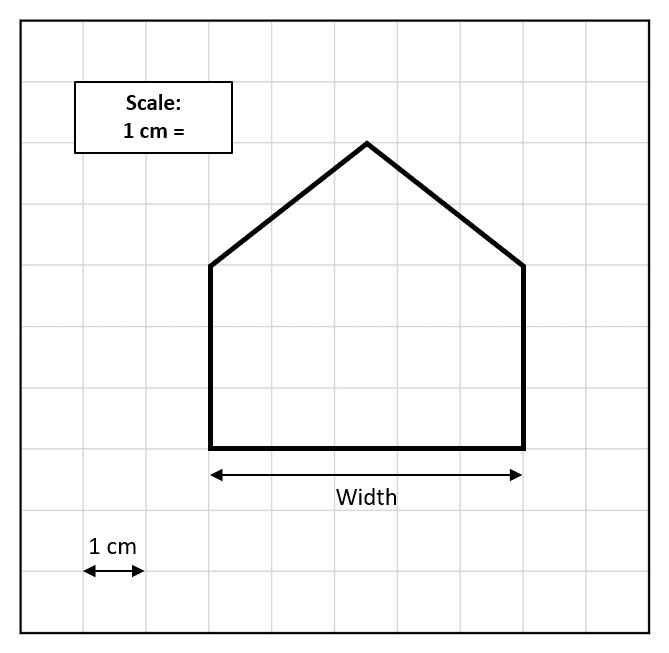
Calculate the scale of the diagram.
We are told that the width of the house is m
In the diagram, the house is cm (five squares) wide.
The scale is therefore:
cm m
Dividing by gives the answer in the correct form:
cm m
Maps and Scale Drawings Example Questions
Question 1: Part of a map is shown below. A and B are the locations of two fast food chains.
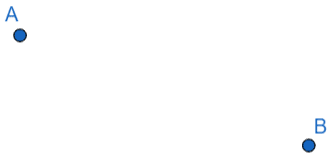
The scale of this map is cm m.
The distance between the two fast food chains on the map is cm.
Find the real-life distance between the two fast food chains.
[1 mark]
The distance on the map is cm
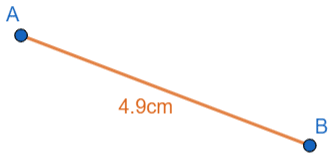
Each one of those centimetres represents m, so we get the actual distance between A and B to be


Question 2: In a city, the bus station is situated m away from the train station. A map is drawn using the scale
cm = m
Work out the distance between the bus station and train station on the map.
[2 marks]
We need to work out how many cm on the map will represent m. Every cm amounts to m, so we must divide the numbers of metres by to get:
Question 3: The scale diagram below shows a person.
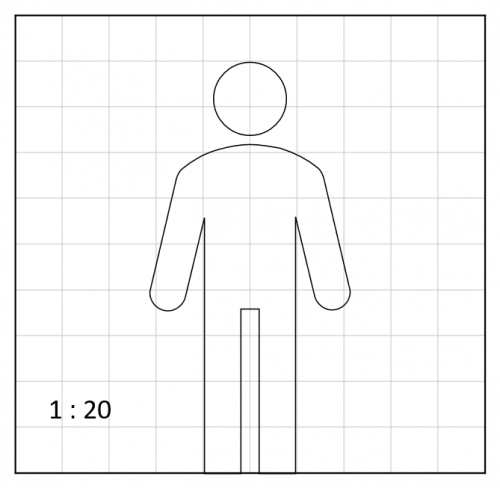
Each square on the grid is cm across.
Calculate the real height of the person.
[2 marks]
In the diagram, the person is squares tall:
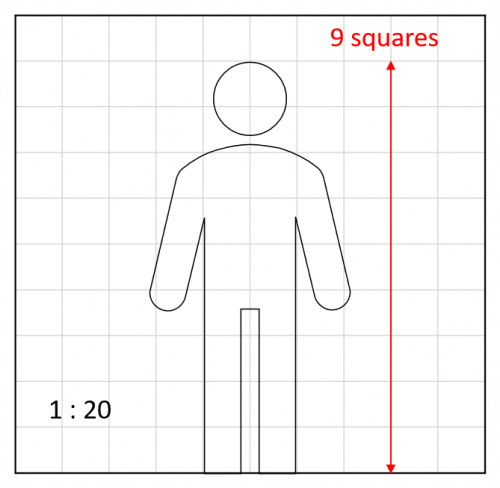
Using the key, cm on the grid is cm in real life.
The height of the person is therefore:
cm or m
Question 4: The diagram below shows a scale drawing of a classic car.

The length of the car on the diagram is cm
The real-life car is m long.
Calculate the scale of the diagram.
[2 marks]
To calculate the scale, we need to first make sure the units are the same in the diagram and the real life car:
m cm
We can now calculate the scale by dividing the real life size by the size in the diagram:
Therefore the scale is
Specification Points Covered
Ratio, proportion and rates of change – 2. use scale factors, scale diagrams and maps
Geometry and measures – 15. measure line segments and angles in geometric figures, including interpreting maps and scale drawings and use of bearings