pH Curves
pH Curves Revision
\text{pH} Curves
Titration curves, also known as \text{pH} curves, show the change in \text{pH} during acid/ base titrations.
\text{pH} Curve Graphs
\text{pH} curves can provide very important information about what is happening in an acid-base titration. Two important things that can be found from \text{pH} curves are the equivalence and half-equivalence points.
Equivalence point: The equivalence point is the point where the titrant has completely neutralised the analyte (the substance in the conical flask, also known as the titrate). The equivalence point lies at the midpoint of the vertical/ steep part of the curve.
Half-equivalence point: This is the point where half of the volume needed for neutralisation has been added to the analyte. At this point, the \text{pH} of the solution is equal to the \text{pK}_a of the acid.
There are four main types of \text{pH} curves can be sketched.
- Strong acid + strong base
- Strong acid + weak base
- Weak acid + strong base
- Weak acid + weak base

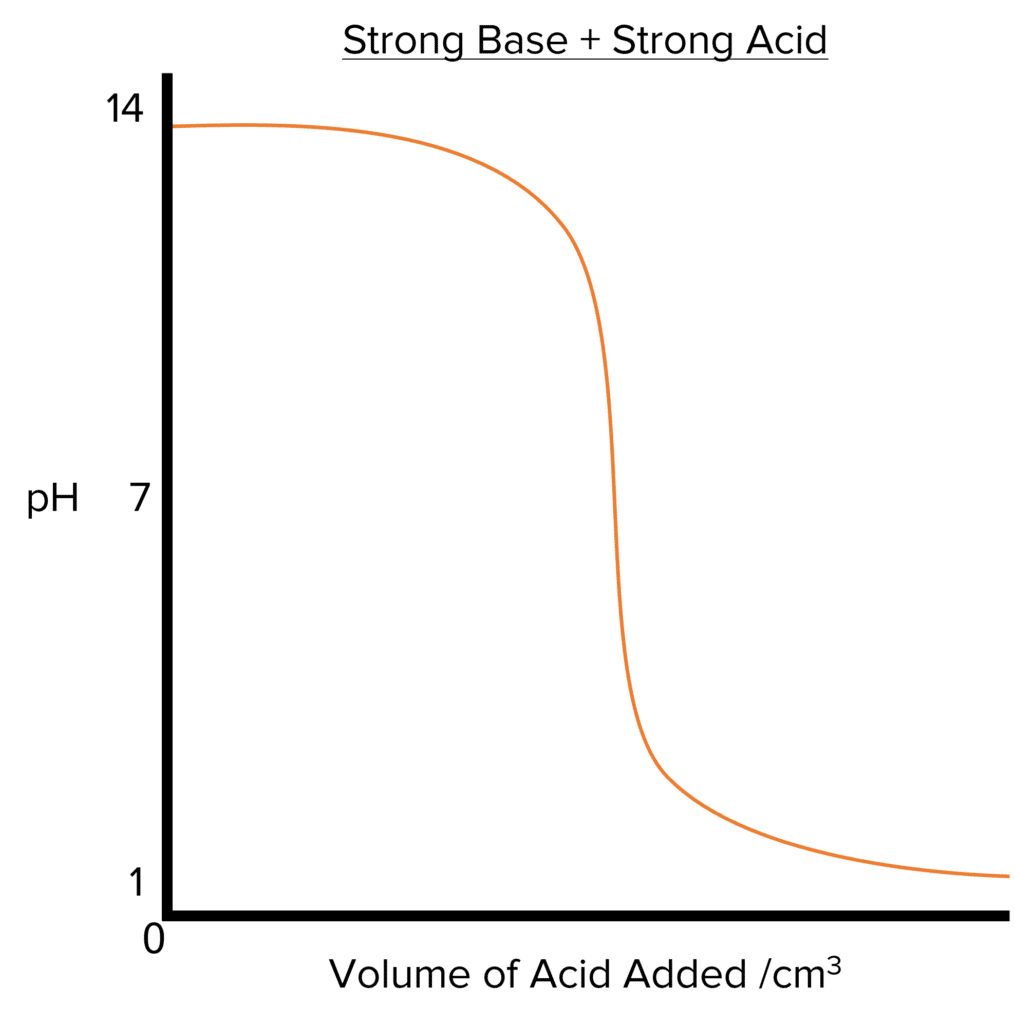

In the graphs above, the base is added to the acid. If the inverse happens and an acid is added to the base, the initial \text{pH} will be high (as we are starting out with a basic system. The final \text{pH} would low (as we are are ending up with an acidic system). The general shape of the remains essentially the same but flipped horizontally.
Required Practical
Constructing pH curves from titrations.
By carrying out an acid-base titration, we can monitor pH changes. These changes are usually represented by pH/ titration curves.
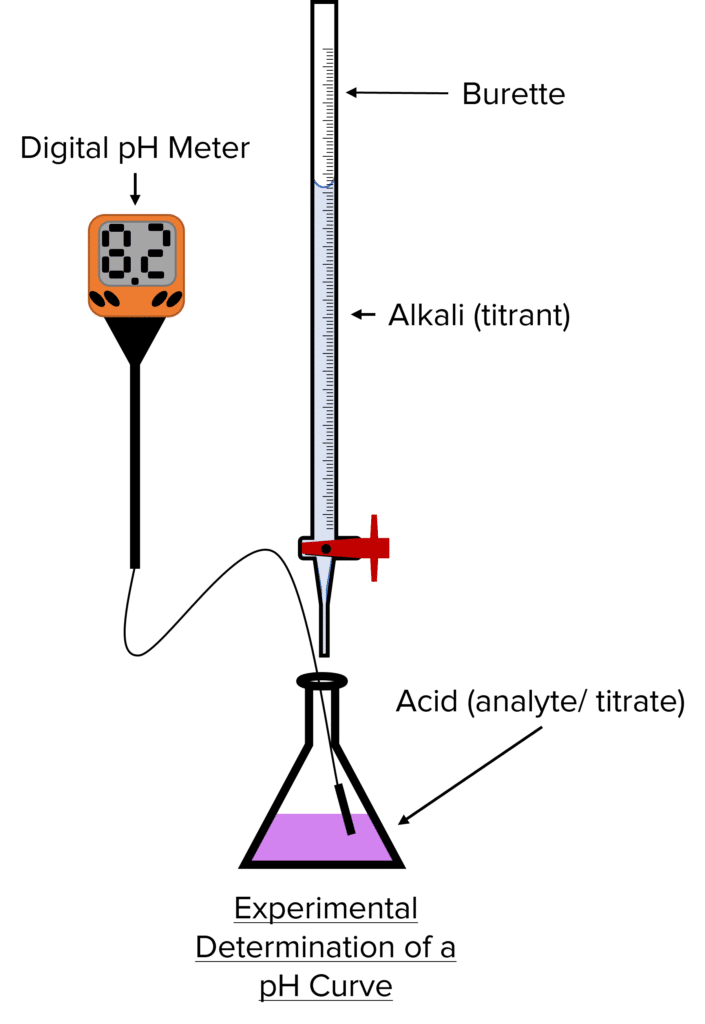

Method: Constructing a pH Curve from Titration
- Using a volumetric pipette, place 25\text{ cm}^3 of acid into a conical flask.
- Measure the \text{pH} of the acid with a calibrated \text{pH} meter. Calibration is important as \text{pH} meters will lose accuracy during storage.
- Using a burette, slowly add a small amount of alkali (1 - 2\text{ cm}^3) to the acid while stirring.
- Measure the \text{pH} of the resulting solution and the volume of alkali added.
- Repeat steps 3 and 4 until near the endpoint of the titration
- Once near the endpoint, add the alkali in smaller increments ((0.1 - 0.2\text{ cm}^3) until it is in excess and measure the \text{pH}.
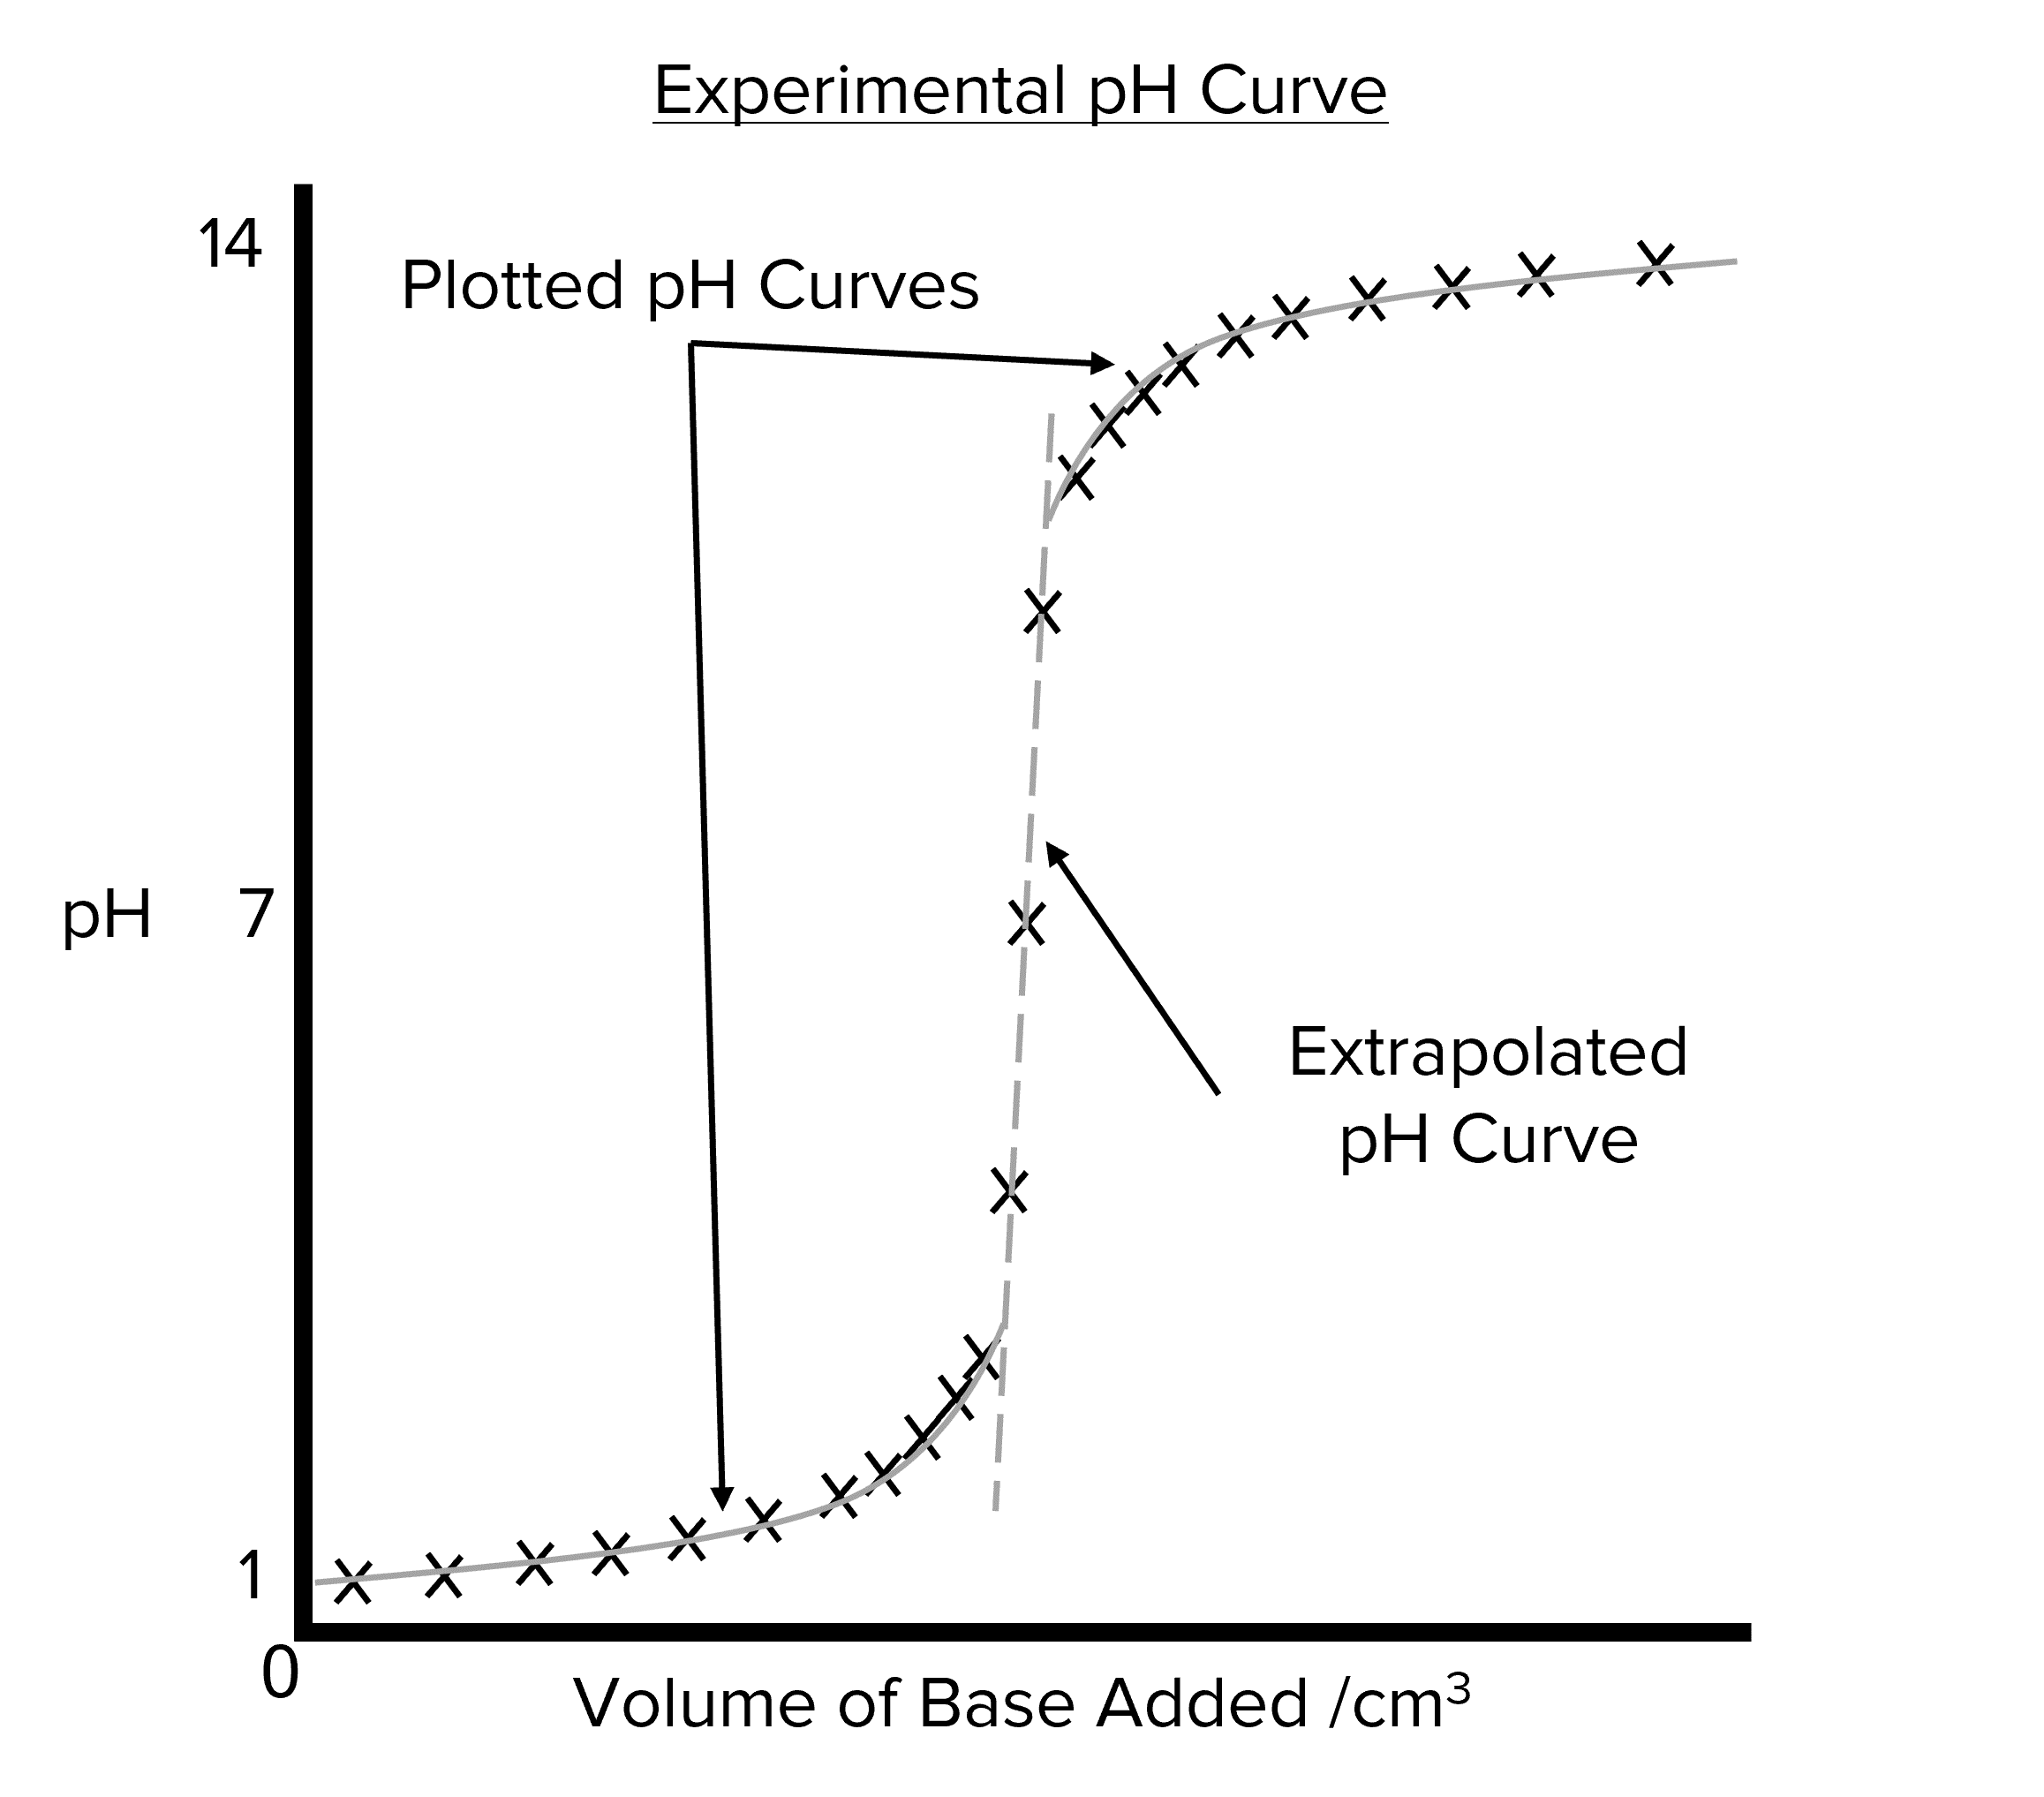
- Plot the results from the \text{pH} meter and extrapolate to approximate the steep part of the curve.
Analysis: Sketching a \text{pH} curve from experimental data.
Analyzing the data from \text{pH} titrations is not as straight forward as simply plotting the data and drawing a line of best fit. During the experiment, the \text{pH} will begin to change very rapidly when close to the equivalence point. This means that its difficult to collect enough data to create a detailed curve for this period of the experiment. To get around this problem there are three steps when drawing out a \text{pH} curve from experimental data.
- Plot the data collected during the experiment on a graph of \text{pH} against volume of base added.
- Draw two curves on the data. One curve should be drawn for the acidic region of the data (i.e. the data at low \text{pH}). The second should e drawn over the alkaline region of the data (i.e. the data at high \text{pH}).
- Extrapolate between the two curves approximate the value of \text{pH} around the equivalence point.
Indicators
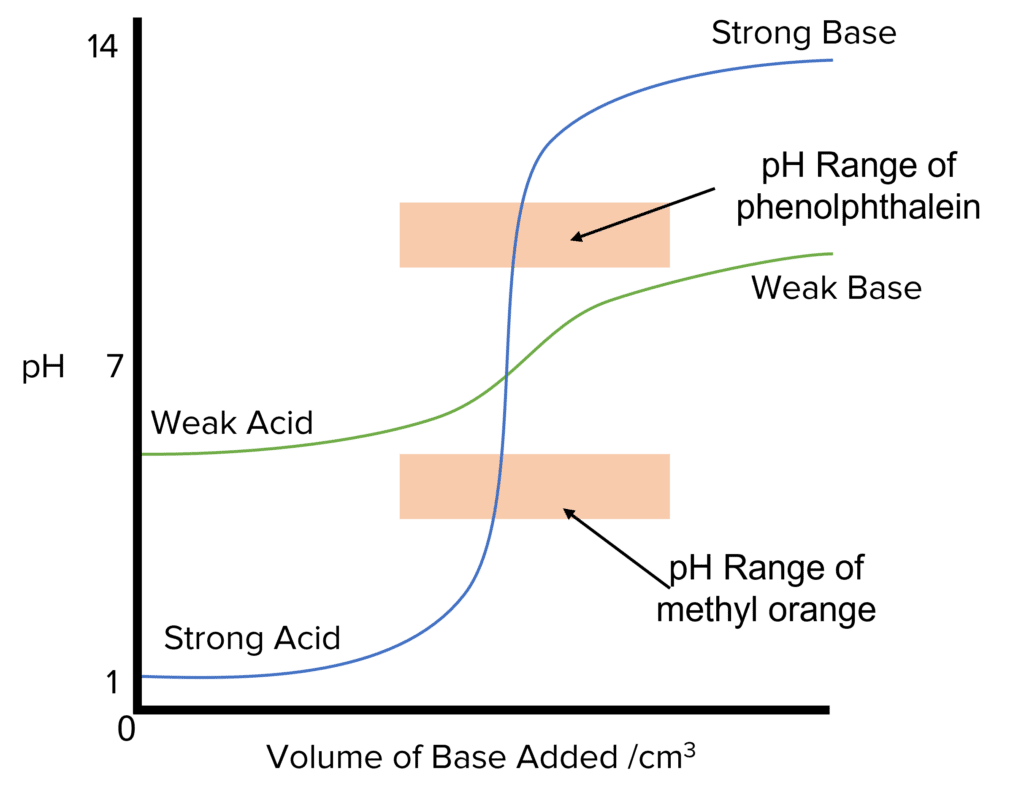

Indicators change colour over a narrow \text{pH} range with different indicators changing colour over different \text{pH} values.
Indicators only work if the \text{pH} range of the indicator falls with the steep section of a \text{pH} curve, so it is essential to choose indicators with ranges that match up to the \text{pH} curves of the chemicals used. The point at which an indicator will change colour during a titration is known as the endpoint of the experiment.
It is much easier to find an appropriate indicator for reactions involving at least one strong base or strong acid. When both a weak base and a weak acid are used, the \text{pH} change is to slow for most indicators.
Some important indicators to know a little about are methyl orange and phenolphthalein.
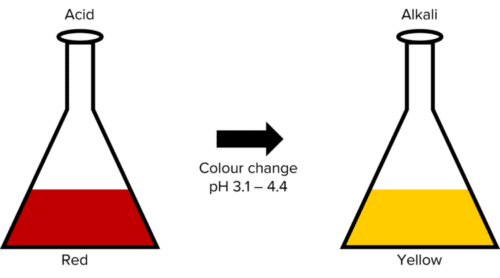
Methyl Orange (represented below) can be used in titrations with strong acids but not weak acids. This is because methyl orange undergoes its colour change roughly between \text{pH: } 3.1 - 4.4. Methyl orange will show red in acidic conditions and yellow in alkaline conditions.
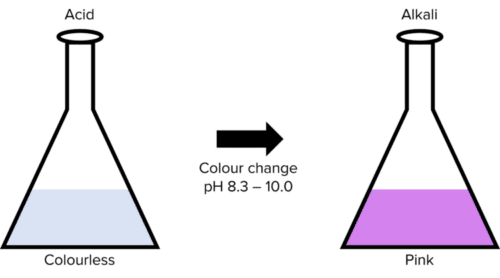
Phenolphthalein can be used in titrations with strong bases but not weak bases. This is because phenolphthalein undergoes its colour change roughly between \text{pH: }8.3 - 10.0. Phenolphthalein will have no colour in acidic conditions but will turn pink in alkaline conditions.
pH Curves Example Questions
Question 1: Ethanoic acid is titrated against sodium hydroxide. From the list below, select the best indicator for the titration. Explain your choice.
| Indicator | \text{pH} Range |
| Methyl Orange | 3.1-4.4 |
| Methyl Red | 4.2-6.3 |
| Bromothymol Blue | 6.0-7.6 |
| Thymol Blue | 8.0-9.6 |
[2 marks]
The best indicator to use would be thymol blue.
Thymol blue is the best choice because the reaction is a weak acid with a strong base OR the equivalence point is greater than 7 OR has a high pH.
Question 2: Explain why \text{pH} meters must be calibrated before use.
[1 mark]
The accuracy of the meter will decrease over time/ with storage.
Question 3: Describe the steps followed to carry out a \text{pH} titration.
[5 marks]
- Measure the pH of the acid.
- Add the alkali in small portions whilst stirring.
- Measure the pH after each addition.
- Repeat until the alkali is in excess.
- Add smaller increments near the endpoint.
Question 4: The \text{pH} of a half-neutralised solution is 3.9. Calculate the value of the acid dissociation constant, \text{K}_a, of the acid used.
[3 marks]
\text{pK}_a=\text{pH at half-equivalence}
\begin{aligned}\text{K}_a&=10^{-\text{pK}_a}\\ &=10^{-3.9}\\ &=\underline{1.26\times10^{-4}}\end{aligned}
(1 mark for correct determination of \text{pK}_a. 2 marks for correct \text{K}_a calculation.)
You May Also Like...

MME Learning Portal
Online exams, practice questions and revision videos for every GCSE level 9-1 topic! No fees, no trial period, just totally free access to the UK’s best GCSE maths revision platform.